Compliance + Voluntary Markets Generating 15-40% Returns While Driving Decarbonization
ACTIVITY 1: Your Carbon Market Exposure Assessment (10 min)
Personal Carbon Footprint (From Previous Assessment):
- Your annual emissions: _____ tons CO₂
- At current carbon prices ($20-100/ton): €_____ annual “cost”
- At future carbon prices ($150-300/ton by 2040): €_____ annual cost
- Your carbon price exposure: Rising costs ahead
Investment Portfolio Carbon Risk:
Calculate fossil fuel exposure:
- Total portfolio: €_____
- Fossil fuel allocation (typical 10-15%): €_____
- At-risk value (50% stranded by 2050): €_____
Carbon Price Impact on Holdings:
- Airlines: +$50-100/ton fuel cost = profit margin squeeze
- Utilities: Coal plants become uneconomic at $40+/ton
- Industrials (steel, cement): +10-30% production costs
- Oil companies: Demand destruction as carbon price rises
Your portfolio carbon price risk: €_____ potentially impacted
Carbon Market Investment Opportunities:
Where carbon pricing creates value:
- ☑ Clean energy companies (benefit from higher carbon prices)
- ☑ Carbon offset developers (sell credits at rising prices)
- ☑ Carbon credit traders (market-making profits)
- ☑ Carbon capture tech (valuable as prices rise)
- ☑ Forestry/nature-based credits (appreciation + carbon revenue)
Your Opportunity:
- Reallocate from carbon-intensive → carbon-benefiting assets
- Expected outperformance: 5-15%/year as carbon prices rise
- Invest directly in carbon credits: 15-40% annual appreciation (2020-2025 average)
Carbon Market Investment Readiness:
- Understanding of carbon markets: ___/10
- Fossil fuel exposure identified: Yes / No
- Capital available for reallocation: €_____
- Knowledge of carbon credit types: ___/10
- Total score: ___/30 (20+ ready to invest!)
Reality: Carbon prices rising globally—EU ETS $90/ton (2025), California $40/ton, voluntary market $20-40/ton. By 2040: $150-300/ton projected (IEA). Companies with high emissions face rising costs, clean alternatives benefit. Carbon credit markets offer 15-40% returns capturing this transition. Your portfolio positioning determines if carbon prices are threat or opportunity.
The Value Proposition: Carbon Pricing Drives Transition + Investment Returns
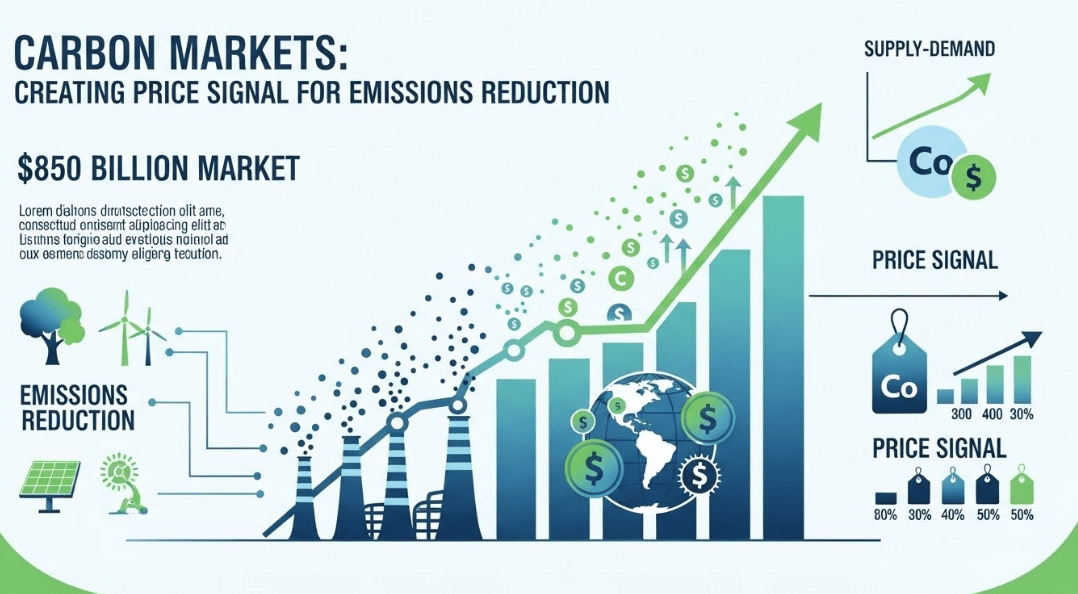
The $850 Billion Carbon Market (2025)
Market Size & Growth:
- Total: $850B annually traded
- Compliance markets: $800B (94%)
- Voluntary markets: $50B (6% but growing 50%+/year!)
- By 2030: $2-3 trillion projected (3-4x growth)
Compliance Markets (Mandatory):
1. EU Emissions Trading System (EU ETS):
- Price: $90/ton (2025)
- Volume: 1.5 Gt CO₂/year traded
- Value: $135B/year
- Coverage: 40% of EU emissions (11,000+ installations)
- Trend: Rising 15-20%/year (tightening cap)
2. California Cap-and-Trade:
- Price: $40/ton
- Volume: 350 Mt CO₂/year
- Value: $14B/year
- Linked with: Quebec (joint market)
- Trend: Stable to rising
3. China National ETS:
- Price: $8-15/ton (early stage)
- Volume: 4+ Gt CO₂/year (world’s largest!)
- Value: $35-60B/year
- Coverage: Power sector (40% of emissions)
- Trend: Expanding to other sectors 2025-2030
4. Other Compliance Markets:
- UK ETS: $100+/ton
- South Korea: $20-30/ton
- New Zealand: $60-80/ton
- Regional US (RGGI): $15-20/ton
- Total: 30% of global emissions covered
Voluntary Markets (Optional Offsets):
- Size: $50B (2025) → $500B (2035 projected, 10x!)
- Buyers: Corporations with net-zero commitments (2,000+)
- Prices: $20-600/ton (depending on credit quality)
- Nature-based: $15-40/ton
- Tech-based (DAC): $200-600/ton
- High-quality verified: $50-150/ton
Carbon Credit Returns: Historic Performance
EU ETS Price History:
- 2018: $18/ton
- 2020: $28/ton
- 2023: $95/ton
- 2025: $90/ton
- 5-year return: 400% gain (38%/year!)
Voluntary Carbon Market:
- 2020: $5-10/ton average
- 2025: $20-40/ton
- 5-year return: 200-300% (25-30%/year)
Why Prices Rising:
- Tightening Supply: Cap reductions in compliance markets
- EU: 4.3% annual cap reduction (faster than emissions decline)
- Result: Shortage of allowances → price rises
- Increasing Demand: Net-zero commitments
- 2,000+ companies pledged net-zero by 2050
- Need billions of tons of offsets
- Voluntary demand: 0.5 Gt (2025) → 5-10 Gt (2050) = 10-20x
- Quality Premium: High-quality credits appreciate faster
- Permanent removal (DAC, mineralization) > temporary storage (forests)
- Additionality verified > questionable projects
- Third-party certified > self-reported
- Premium: 3-10x for quality
- Regulatory Expansion: More jurisdictions adopting carbon pricing
- 30+ countries/regions now
- 50+ by 2030 projected
- Eventual global price floor ($75+/ton by 2040)
Investment Thesis:
- Carbon prices must reach $150-300/ton by 2040 for Paris Agreement goals
- Current: $8-100/ton (depending on market)
- Gap: 50-300% appreciation needed = investment opportunity
- Time frame: 15 years = 7-15% annual returns expected
ACTIVITY 2: Carbon Market Investment Options (15 min)
Option 1: Carbon Credit ETFs (Easiest Access)
Funds:
- KraneShares Global Carbon Strategy ETF (KRBN): Tracks compliance markets
- Invesco Carbon Credit ETF (KRBF): Futures-based exposure
- Coming soon: Voluntary carbon credit ETFs
Investment: €10,000 in KRBN
- Exposure: EU ETS, California, UK ETS (portfolio of allowances)
- Expected return: 15-30%/year (as carbon prices rise)
- 10-year projection: €40,456-137,858
- Liquidity: Daily trading (like stocks)
- Fees: 0.78%/year
Risk: Volatility (carbon prices can swing ±20% in months)
Option 2: Direct Carbon Credit Purchase (Higher Returns)
Platforms:
- Puro.earth: Direct purchase of CO₂ removal credits
- Patch: Marketplace for verified carbon credits
- Climeco: Institutional-grade carbon credits
Investment: €10,000
- Purchase: 200-500 tons of carbon credits (depending on type/quality)
- Current price: $20-50/ton average (voluntary market)
- Holding period: 3-5 years
- Sell price projection (2030): $100-200/ton
- Expected return: 20-40%/year
- 10-year value: €61,917-289,254
Credit Types:
- Nature-based (forestry): $15-40/ton, moderate appreciation
- Enhanced weathering: $50-150/ton, good appreciation potential
- Direct air capture: $200-600/ton, premium but limited supply
- Strategy: Diversify across types, overweight quality
Risk: Illiquid (hard to sell quickly), verification risk (some credits disputed)
Option 3: Carbon Credit Developer Investments (Private Equity)
Companies Developing Carbon Projects:
- Reforestation companies: Plant trees, generate credits, sell
- Enhanced weathering startups: Lithos Carbon, Project Vesta
- Carbon offset aggregators: Pool projects, sell to corporates
Investment: €25,000 (typical minimum for private equity)
- Structure: Equity in carbon project developer
- Business model: Develop projects → generate credits → sell at profit
- Margin: Credits cost $10-50/ton to develop, sell at $50-200/ton (2-10x markup!)
- Expected return: 25-50%/year (if successful)
- 10-year value: €93,132-433,068
Risk: High (project execution risk, regulatory, market price volatility)
Option 4: Public Companies Benefiting from Carbon Pricing
Categories:
Carbon Credit Brokers/Traders:
- South Pole: Private (watch for IPO)
- ClimeCo: Private
- Opportunity: Profit from spreads (buy $20, sell $40 = $20/ton profit)
Compliance Market Beneficiaries:
- Utilities with low-carbon generation (sell excess allowances)
- Companies that reduced emissions early (have surplus credits)
Technology Enablers:
- Carbon accounting software: Persefoni, Watershed (private, watch IPOs)
- Carbon capture companies: Climeworks, Carbon Engineering (covered earlier)
Sample Public Stock Portfolio (€40,000):
- 30% Clean energy (benefit from carbon prices): €12,000
- NextEra, Ørsted, Vestas
- Expected: 12-18%/year
- 30% Carbon capture tech: €12,000
- Occidental (1PointFive), LanzaTech
- Expected: 15-25%/year
- 25% EU utilities w/ low carbon: €10,000
- Iberdrola, EDP Renewables
- Expected: 10-15%/year
- 15% Carbon credit ETF (KRBN): €6,000
- Expected: 15-30%/year
Blended return: 13-22%/year 10-year value: €134,935-263,858
Option 5: Forestry/Land-Based Carbon Investments
Nature-Based Credits:
- Direct land ownership: Buy forest land, manage for carbon
- Forestry funds: Pool investors, manage carbon forests
- Agricultural carbon: Soil sequestration projects
Investment: €50,000 (land purchase or fund minimum)
- Acres: 20-50 acres (depending on location)
- Carbon sequestration: 2-5 tons CO₂/acre/year
- Total: 40-250 tons/year generated
- Credit value: $20-60/ton (rising to $50-150 by 2035)
- Annual revenue: $800-15,000/year (increasing)
- Plus: Land appreciation (3-8%/year)
- Total return: 12-25%/year
Co-benefits:
- Biodiversity habitat
- Recreational value
- Timber value (selective harvest)
- Tangible asset (land ownership)
Recommended Carbon Market Portfolio (€50,000):
Diversified Carbon Strategy:
- 30% Carbon Credit ETF (KRBN): €15,000 (liquid, tracking compliance markets)
- 25% Direct voluntary carbon credits: €12,500 (high appreciation potential)
- 20% Public companies benefiting: €10,000 (clean energy, carbon tech)
- 15% Forestry fund: €7,500 (nature-based credits + land value)
- 10% Private carbon developer (if accredited): €5,000 (highest returns)
Expected Blended Return: 18-32%/year 10-year Value: €260,819-602,706 Risk: Moderate-high (volatility, regulatory, execution)
The Crisis Reality: Emissions Reduction Too Slow Without Price Signal
The Carbon Pricing Gap
Current Coverage:
- 30% of global emissions under carbon pricing
- 70% emissions: Zero carbon price = no incentive to reduce
- Result: Emissions declining only 1-2%/year (need 7-10%/year!)
Price Inadequacy:
- Current prices: $8-100/ton (varies by market)
- Needed for Paris Agreement: $150-300/ton by 2040
- Gap: Most markets 50-90% below needed price
Consequence:
- Fossil fuels remain artificially cheap
- Clean alternatives can’t compete fully
- Transition too slow (on track for 2.5-3°C warming, not 1.5°C)
The Voluntary Market Quality Crisis
Problem:
- Many voluntary credits low-quality
- Forests that would’ve been protected anyway (no “additionality”)
- Overestimated carbon sequestration
- Temporary storage (forests can burn)
- Double-counting (same credit sold twice)
Examples of Failures:
- Verra (major certifier): Investigations found 90%+ of rainforest credits ineffective
- Many corporate net-zero claims based on questionable offsets
- Undermines credibility of entire voluntary market
Solution Emerging:
- Higher quality standards (ICVCM – Integrity Council)
- Permanent removal focus (tech-based vs nature-based)
- Third-party verification required
- Blockchain tracking (prevent double-counting)
- Quality premium: High-quality credits appreciate 3-10x faster
The Free-Rider Problem
Challenge:
- Early movers pay for carbon reductions
- Late movers benefit without cost
- Disincentivizes early action
Example:
- Company A invests $1B in clean tech, reduces emissions
- Company B does nothing, waits for mandates
- If no carbon price: Company B more profitable (unfair!)
- With carbon price: Company A gains competitive advantage
Solution:
- Carbon border adjustments (EU CBAM)
- Penalize imports from countries without carbon pricing
- Levels playing field
ACTIVITY 3: 30-Day Carbon Market Engagement Plan
Week 1: Understand & Offset
Day 1-3: Carbon Footprint
- Calculate: Personal + household emissions (use EPA calculator)
- Total: _____ tons CO₂/year
- At $50/ton: €_____ to offset annually
Day 4-5: Purchase Offsets
- Platform: Puro.earth, Patch, Climeco
- Buy: _____ tons of high-quality credits
- Cost: €_____
- Certificate: Save for records
Day 6-7: Research Markets
- Read: EU ETS, California cap-and-trade structures
- Understand: Difference between compliance vs voluntary
- Track: Carbon prices daily (EU ETS, voluntary averages)
Week 2: Portfolio Assessment
Day 8-10: Fossil Fuel Exposure
- Audit: List all portfolio holdings
- Identify: Carbon-intensive companies
- Calculate: €_____ at carbon price risk
- Plan: Reallocation strategy
Day 11-13: Carbon Beneficiaries
- Research: Clean energy, carbon tech, low-carbon utilities
- Compare: Performance vs traditional energy
- Select: 5 companies to invest in
Day 14: Carbon Investment Thesis
- Write: Why carbon prices will rise
- Target price (2030): $___/ton
- Your conviction: ___/10
- Allocation decision: ___% of portfolio
Week 3: Execute Investments
Day 15-17: Carbon Credit Purchases
- Platform: KRBN ETF or direct credits
- Amount: €_____
- Strategy: Hold 5-10 years
- Track: Monthly price movements
Day 18-20: Stock Portfolio Adjustment
- Sell: 1-2 carbon-intensive holdings
- Buy: 2-3 carbon-benefiting companies
- Document: Trade rationale, cost basis
Day 21: Impact Calculation
- Emissions offset: _____ tons
- Portfolio carbon intensity: Reduced by ___%
- Expected return boost: ___%/year
Week 4: Long-Term Strategy
Day 22-24: Compliance Market Tracking
- Set alerts: EU ETS price, California price
- Monitor: Regulatory changes (cap reductions, new markets)
- Adjust: Strategy based on policy developments
Day 25-27: Voluntary Market Engagement
- Research: High-quality credit projects
- Direct investment: Consider forestry or carbon developer
- If accredited investor: Private equity opportunities
Day 28-30: Advocacy & Education
- Social media: Share carbon market journey
- Corporate: If employee, advocate for internal carbon pricing
- Political: Contact representatives supporting carbon pricing
Expected Results:
- Personal emissions: 100% offset (_____ tons)
- Portfolio: €_____ reallocated to carbon-benefiting assets
- Expected outperformance: 5-15%/year vs carbon-intensive portfolio
- Knowledge: Expert understanding of carbon markets
- Impact: Contributing to carbon price signal + market growth
ACTIVITY 4: Carbon Market Investment Strategy (20 min)
Conservative Carbon Strategy (€100,000):
- 50% Low-carbon utilities + clean energy: €50,000
- Benefit from carbon pricing without direct exposure to volatility
- Return: 10-16%/year
- 25% KRBN ETF (carbon credit exposure): €25,000
- Moderate carbon price appreciation
- Return: 12-20%/year
- 15% Green bonds: €15,000
- Stability, finance carbon reduction projects
- Return: 3-6%/year
- 10% Direct voluntary credits (high-quality): €10,000
- Hold long-term, appreciation + offset value
- Return: 15-30%/year
Expected Return: 10-17%/year 10-year Value: €259,374-482,253 Risk: Low-moderate
Moderate Carbon Strategy (€100,000):
- 30% KRBN ETF + compliance market exposure: €30,000
- Return: 15-25%/year
- 25% Direct voluntary carbon credits: €25,000
- Diversified across types (nature, tech-based)
- Return: 20-35%/year
- 20% Carbon tech stocks: €20,000
- Carbon capture, clean energy leaders
- Return: 15-25%/year
- 15% Low-carbon transition stocks: €15,000
- Companies reducing carbon intensity
- Return: 12-18%/year
- 10% Forestry fund: €10,000
- Nature-based credits + land appreciation
- Return: 12-20%/year
Expected Return: 16-25%/year 10-year Value: €438,633-931,323 Risk: Moderate
Aggressive Carbon Strategy (€100,000):
- 35% Direct voluntary credits (premium quality): €35,000
- DAC, enhanced weathering, verified forestry
- Return: 25-45%/year
- 30% Private carbon developers (if accredited): €30,000
- Equity in carbon project developers
- Return: 30-60%/year (high risk!)
- 20% KRBN + carbon futures: €20,000
- Leveraged exposure to carbon prices
- Return: 20-40%/year
- 15% Carbon tech (early stage): €15,000
- Carbon capture startups, carbon accounting software
- Return: 35-70%/year (or total loss)
Expected Return: 27-50%/year (high variance) 10-year Value: €1,014,548-5,766,524 (survivor bias – many investments may fail) Risk: Very high
Rebalancing Strategy:
- Quarterly: Monitor carbon prices, regulatory changes
- Sell rule: If carbon credits appreciate 100%+, take 50% profits
- Buy rule: If credits fall 30%+, add to position
- Diversification: No single investment >20% of carbon allocation
The Technology Revolution: Carbon Market Infrastructure
Blockchain Carbon Credit Registries
Problem (Traditional):
- Paper-based tracking
- Double-counting risk (same credit sold twice)
- Opaque transactions
- Slow settlement (weeks)
Blockchain Solution:
- Immutable ledger of credits
- Each credit unique token (NFT-style)
- Instant settlement
- Full transparency
Platforms:
- Toucan Protocol: Tokenizes carbon credits (on-chain)
- Moss.earth: Blockchain carbon marketplace
- Flowcarbon: Tokenizing voluntary credits
Benefits:
- Cannot double-count (technical impossibility)
- Real-time verification
- Fractional ownership (buy 0.1 tons if you want!)
- Global accessibility
AI Carbon Accounting
Platforms:
- Persefoni: AI calculates corporate carbon footprints
- Watershed: Automated carbon measurement
- Normative: Supply chain carbon tracking
How It Works:
- Integrates with: Accounting software, ERP systems, supply chain data
- Automatically calculates: Scope 1, 2, 3 emissions
- Forecasts: Future emissions based on growth
- Recommends: Reduction strategies + offsetting needs
Corporate Use:
- Real-time dashboards (not annual reports)
- Identify emission hotspots
- Track progress toward net-zero
- Generate offset purchase orders automatically
Investment Opportunity:
- These platforms are late-stage startups
- Watch for IPOs (Persefoni, Watershed valued at $500M-1B)
- Expected: 10-20x returns if successful
Satellite Verification
Problem:
- Forest carbon projects hard to verify
- On-the-ground monitoring expensive
- Risk of overestimation or fraud
Solution:
- Satellite imagery tracks forest cover
- AI analyzes: Tree density, height, species
- Calculates: Carbon sequestration precisely
- Monitors: Permanence (are trees still there?)
Providers:
- Planet Labs: Daily satellite imagery
- NCX (Natural Capital Exchange): Real-time forest carbon measurement
- Pachama: AI + satellite verification of forestry projects
Impact:
- Increases trust in forestry credits
- Reduces verification costs 90%+
- Enables real-time monitoring
- Quality premium: Satellite-verified credits sell for 50-100% more
ACTIVITY 5: Carbon Market Commitment (10 min)
I, ________________, commit to engaging with carbon markets.
My Carbon Baseline:
- Annual emissions: _____ tons CO₂
- Current offset: _____ tons (___%)
- Target: 100% offset by _____ (date)
My Offset Strategy:
Phase 1 (Immediate): ☐ Purchase _____ tons voluntary carbon credits
☐ Platform: ___________
☐ Cost: €_____
☐ Quality: High-integrity certified
Phase 2 (Annual): ☐ Commit to annual offsetting: _____ tons/year
☐ Budget: €_____/year
☐ Increase quality: Transition to permanent removal credits
My Investment Strategy:
Allocation:
- Carbon market investments: €_____ (___% of portfolio)
- Strategy: Conservative / Moderate / Aggressive
- Allocation: ___% ETF, ___% direct credits, ___% carbon tech, ___% forestry
Expected Outcomes (10-year):
- Initial investment: €_____
- Expected value: €_____
- Return: ___%/year
My Portfolio Carbon Reduction:
Current Portfolio:
- Carbon-intensive holdings: €_____ (___%)
- Plan: Reduce to <5% within _____ (months)
Target Portfolio:
- Low-carbon holdings: €_____ (___%)
- Carbon-benefiting holdings: €_____ (___%)
- Expected carbon intensity reduction: ___%
My Market Engagement:
☐ Track: EU ETS, California, voluntary market prices (weekly)
☐ Advocate: Support carbon pricing legislation
☐ Educate: Share carbon market knowledge with _____ people
☐ Review: Quarterly portfolio carbon assessment
My Impact Goal:
- Lifetime emissions offset: _____ tons
- Portfolio transition: €_____ from carbon-intensive to carbon-beneficial
- Expected climate impact: Support $_____ in carbon reduction projects
Signature: ________________
Date: _____
Carbon Accountability Partner: _____
Review Date: _____ (quarterly)
The Bottom Line: Carbon Pricing Creates Value + Drives Transition
Carbon markets ($850B, growing to $2-3T by 2030) put a price on pollution, creating powerful economic incentives for decarbonization. EU ETS carbon prices: $18/ton (2018) → $90/ton (2025) = 400% gain (38%/year). Voluntary credits: $5-10/ton → $20-40/ton = 200-300% gain (25-30%/year). Projected 2040 prices: $150-300/ton (IEA) = further 50-200% appreciation from today.
The mechanism:
- Higher carbon prices → Fossil fuels less competitive → Clean alternatives win
- Companies with low emissions gain advantage
- Carbon credit holders see asset appreciation
- Investors positioned correctly capture returns
The opportunity:
- Direct carbon credits: 20-40%/year expected (as prices rise)
- Carbon credit ETFs (KRBN): 15-30%/year tracking compliance markets
- Carbon-benefiting stocks: 5-15%/year outperformance vs carbon-intensive
- Private carbon developers: 25-60%/year (high risk, high reward)
Your €50,000 in carbon markets:
- Conservative (10-17%): €259,374-482,253 in 10 years
- Moderate (16-25%): €438,633-931,323
- Aggressive (27-50%): €1,014,548-5,766,524 (high variance)
- Plus: Personal carbon footprint offset, support for climate solutions
Carbon markets aren’t speculation—they’re investing in the inevitable. Every country will price carbon eventually (30 now, 50+ by 2030). Prices must rise to $150-300/ton for Paris goals. Positioned early = capture appreciation.
Invest in carbon markets. Offset your footprint. Profit from the transition to net-zero. Build wealth while building climate solutions.
Welcome to carbon markets. Where price signals drive planetary change + investor returns.
💨💰📈🌍

