Why Crumbling Infrastructure Creates the Largest Investment Opportunity in History
ACTIVITY 1: The Infrastructure Dependency Check
Track every piece of infrastructure you use in 24 hours:
Morning Commute:
- Roads/bridges: ✓ (grade: ___ many in poor condition)
- Public transit: ✓ (age: ___ often 30-50 years old)
- Traffic signals: ✓ (outdated technology)
- Water pipes: ✓ (invisible, many 80-100 years old)
- Sewer system: ✓ (often combined with stormwater, overflows)
At Work/Home:
- Building: ___ years old (40-60 average, inefficient)
- Electricity grid: ✓ (1950s-1970s technology)
- Internet: ✓ (varies widely by location)
- HVAC system: ___ years old (often past lifespan)
Count infrastructure touchpoints: 30-50+ daily
Now the crisis:
- 43% of US roads in poor/mediocre condition
- 45,000 bridges structurally deficient
- Water main breaks every 2 minutes (260,000 annually)
- Buildings responsible for 40% of emissions
- Grid vulnerable to blackouts (increasing frequency)
Reality: You depend on 50-100 year old infrastructure every day. And it’s failing.
Time to complete: 24 hours awareness
Cost: Free
What you learned: Critical infrastructure is old, inefficient, and breaking
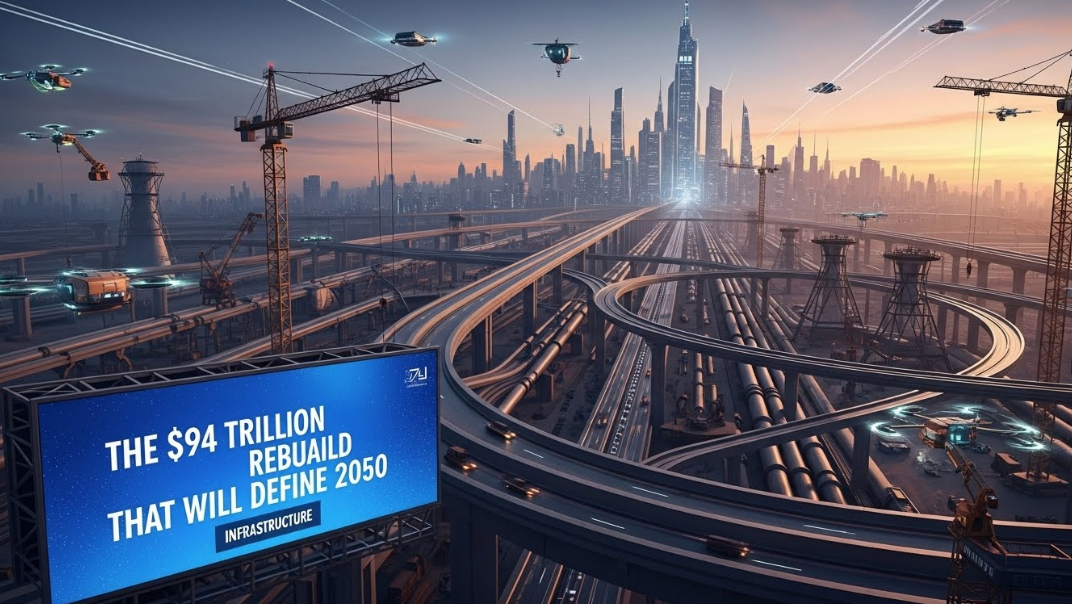
Here’s the infrastructure reality: $94 trillion needed globally for infrastructure through 2040 (McKinsey). US alone needs $2.6 trillion for repairs by 2029. But crisis = opportunity. Smart infrastructure offers 10-35% returns while modernizing systems.
The breakdown:
- Buildings: $11 trillion green building market by 2030
- Mobility: $7 trillion EVs, transit, smart systems
- Energy grid: $14 trillion clean energy infrastructure
- Water: $6.5 trillion pipes, treatment, conservation
- Digital: $3.7 trillion 5G, fiber, data centers
Crumbling infrastructure = disaster. Smart infrastructure = $94 trillion wealth creation.
The Value Proposition: Smart Infrastructure = Returns + Resilience
The Infrastructure Investment Gap
Current State:
- Global infrastructure: $3.7 trillion invested annually
- Needed: $6 trillion annually to maintain + upgrade
- Gap: $2.3 trillion annually ($94 trillion through 2040)
Consequences of Gap:
- Economic losses: $3.7 trillion by 2040 (delays, inefficiency)
- Safety risks: Bridge collapses, water contamination, blackouts
- Emissions: Old infrastructure 40% less efficient
- Competitiveness: Countries with modern infrastructure outperform
Who Pays:
- Governments: 70% of infrastructure spending
- Private sector: 20% (growing via PPPs)
- Users: 10% (tolls, fees)
But: Crisis creating massive investment opportunities in infrastructure modernization.
Smart Infrastructure ROI
Green Buildings (10-20% Returns):
- LEED-certified buildings: 8% higher value, 10% rent premium
- Net-zero buildings: 20-30% lower operating costs
- Retrofits: 15-30% energy savings, 3-7 year payback
- Market: $11 trillion by 2030
Smart Mobility (12-25% Returns):
- EV charging networks: 20-30% IRR
- Transit-oriented development: 15-25% property premium
- Bike infrastructure: $11 return per $1 invested
- Market: $7 trillion through 2030
Grid Modernization (8-15% Returns):
- Smart meters: 10-20% energy savings
- Grid storage: 12-18% returns
- Transmission upgrades: Enable renewable integration
- Market: $14 trillion through 2040
Water Infrastructure (10-18% Returns):
- Smart water systems: 20-30% loss reduction
- Desalination: 12-18% returns in water-scarce regions
- Stormwater management: $2-4 return per $1 (flood prevention)
- Market: $6.5 trillion through 2030
The Pattern: Modern infrastructure is more efficient, more resilient, and higher-returning than old infrastructure.
ACTIVITY 2: The Infrastructure Quality Scorecard
Rate infrastructure quality in your area (1-10 scale):
Transportation:
- Road condition: ___ (10=perfect, 1=potholed nightmare)
- Bridge safety: ___ (based on visible condition)
- Public transit: ___ (frequency, reliability, coverage)
- Bike infrastructure: ___ (protected lanes, connectivity)
- Pedestrian infrastructure: ___ (sidewalks, crossings) Transportation Score: ___/50
Buildings:
- Energy efficiency: ___ (insulation, windows, HVAC)
- Safety/maintenance: ___ (structural condition)
- Accessibility: ___ (elevators, ramps, universal design) Buildings Score: ___/30
Utilities:
- Water quality: ___ (taste, safety, pressure)
- Electricity reliability: ___ (blackouts per year, voltage)
- Internet speed: ___ (Mbps, reliability) Utilities Score: ___/30
Total Infrastructure Score: ___/110
Benchmarks:
- 90-110: World-class (Singapore, Netherlands, Switzerland)
- 70-89: Good (Germany, Japan, Canada)
- 50-69: Adequate but aging (US, UK, France)
- 30-49: Poor (many developing countries)
- Under 30: Crisis level
Your Score: ___/110
Economic Impact:
- Every 10-point improvement = 0.5-1% GDP growth
- Your potential if upgraded to 90+: ___%GDP improvement
Time to complete: 20 minutes
Cost: Free
Insight: Quantify infrastructure quality where you live
The Technology Revolution: Smart Infrastructure 2.0
Digital Transformation of Physical Infrastructure
1. Smart Buildings (Building 4.0)
Traditional buildings: Dumb structures with separate systems (lighting, HVAC, security all independent).
Smart buildings: Integrated AI-powered systems optimizing everything in real-time:
- AI HVAC: Learns occupancy patterns, weather forecasts, optimizes for comfort + cost (20-40% energy savings)
- Smart lighting: Occupancy sensors, daylight harvesting (30-50% savings)
- Predictive maintenance: Sensors detect equipment problems before failure (reduce downtime 30-50%)
- Energy management: Real-time monitoring and optimization (15-25% total savings)
Market leaders: Siemens, Schneider Electric, Honeywell, Johnson Controls
ROI: Smart building systems cost €50-150/sqm but save €20-50/sqm annually. Payback 3-7 years.
2. Intelligent Transportation Systems (ITS)
Traditional: Traffic lights on timers, roads as passive infrastructure.
Smart: AI-optimized traffic flow, vehicle-to-infrastructure communication:
- Adaptive traffic signals: Adjust in real-time to traffic (reduce congestion 15-30%)
- Smart parking: Guide drivers to open spots (reduce circling 30-50%)
- Congestion pricing: Dynamic pricing reduces traffic (20-30% reduction in zones)
- Autonomous vehicles: Enable 3-5x more vehicles per lane (decades away but coming)
Cities implementing: Singapore, London, Stockholm, Barcelona
ROI: ITS investments return $4-9 per $1 through reduced congestion, fuel savings, emissions cuts.
3. Digital Water Networks
Traditional: Underground pipes with no monitoring, high losses.
Smart: Sensors throughout network detecting leaks, optimizing flow:
- Smart meters: Real-time consumption data (reduce usage 10-20%)
- Leak detection: Acoustic sensors finding leaks early (reduce losses 20-40%)
- Pressure management: Optimize pressure to minimize breaks (extend pipe life 30-50%)
- Water quality monitoring: Real-time contamination detection
Economics: Water losses cost €14 billion globally. Smart systems recover 30-50% of losses.
ROI: €1 invested in smart water systems returns €2-4 in reduced losses and efficiency.
4. Smart Grid 2.0
Traditional grid: One-way power flow, centralized generation, vulnerable to blackouts.
Smart grid: Two-way communication, distributed generation, resilient:
- Smart meters: Enable time-of-use pricing, demand response (shift 10-20% usage off-peak)
- Grid-scale storage: Batteries smooth renewables, provide backup (enabling 80-100% renewable grids)
- Microgrids: Local networks that can island during emergencies (resilience)
- AI optimization: Machine learning balancing supply/demand in real-time
Investment: $14 trillion through 2040. Returns: 10-15% through efficiency, renewables integration, resilience.
5. 5G Infrastructure
Enabling smart everything through high-speed, low-latency connectivity:
- Smart cities: Sensors everywhere generating real-time data
- Autonomous vehicles: Require millisecond latency
- Remote surgery: High-bandwidth, low-latency critical
- Industrial automation: Factory-wide wireless coordination
Investment: $3.7 trillion through 2030. Economic benefit: $13 trillion value created by 2035.
ACTIVITY 3: The 30-Day Infrastructure Awareness Challenge
Document infrastructure use and quality:
Week 1: Transportation
- Day 1-3: Track all transportation, note infrastructure quality
- Day 4-5: Try alternative modes (if road bad, try transit; if transit bad, try bike)
- Day 6-7: Calculate time lost to poor infrastructure (traffic, delays)
Week 2: Buildings
- Day 8-10: Audit building efficiency (drafts, lighting, HVAC performance)
- Day 11-13: Research green building standards (LEED, Passive House, etc.)
- Day 14: Calculate energy waste from inefficient building
Week 3: Utilities
- Day 15-17: Track electricity usage, monitor reliability (blackouts, brownouts)
- Day 18-20: Test water quality, note pressure issues
- Day 21: Calculate costs of poor utility infrastructure
Week 4: Advocacy
- Day 22-24: Contact local officials about infrastructure priorities
- Day 25-27: Attend city council or planning meeting
- Day 28-30: Write letter to editor or post on social media about infrastructure needs
Expected Results:
- Infrastructure touchpoints identified: 30-50+
- Quality issues documented: 10-20
- Economic cost calculated: €200-1,000 annually per person
- Advocacy initiated: Voice heard by decision-makers
Share: #InfrastructureMatters
Time commitment: 30-60 min daily
Financial impact: Quantify costs of poor infrastructure
Civic impact: Pressure for improvements
The Crisis Reality: Infrastructure Failing Globally
United States: $2.6 Trillion Backlog
American Society of Civil Engineers (ASCE) Infrastructure Report Card 2021: C-
Roads: D
- 43% in poor/mediocre condition
- Cost to drivers: $1,000+ annually (damage, fuel waste, time)
- Needed investment: $786 billion over 10 years
Bridges: C
- 45,000 bridges structurally deficient (7.5% of total)
- 178 million trips daily across deficient bridges
- Collapses: Pittsburgh 2022, Minneapolis 2007, others
Water: C-
- Main breaks: Every 2 minutes (260,000 annually)
- Lead pipes: 6-10 million service lines (Flint crisis example)
- Needed investment: $625 billion over 10 years
Transit: D-
- $176 billion backlog in repairs
- Systems 30-50 years old
- Ridership recovering slowly post-COVID
Energy: C-
- Grid increasingly vulnerable (blackouts up 60% since 2015)
- $150 billion needed for grid modernization
- Renewable integration requires massive investment
Total US Need: $2.6 trillion over 10 years just for repairs, $6+ trillion for modernization
Europe: €3 Trillion Investment Gap
Europe doing better than US but still facing massive needs:
- €3 trillion investment gap through 2030
- Rail infrastructure aging (60-100 years old in places)
- Water networks losing 25% (23 billion cubic meters annually)
- Building stock 70% built before energy efficiency standards
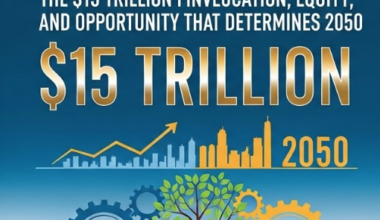
Developing World: $15 Trillion Gap
Most severe infrastructure deficits in Africa, South Asia, Latin America:
- 1 billion people without electricity
- 2 billion without safe drinking water
- 3 billion without internet access
- Massive urbanization (1 million new urban residents weekly) requiring infrastructure for all
Investment needed: $15+ trillion through 2040
ACTIVITY 4: The Infrastructure Investment Portfolio
Position for infrastructure boom:
Infrastructure Investment Themes:
1. Construction & Materials (8-15% returns)
- Construction companies (Bechtel, Skanska, Vinci, etc.)
- Building materials (cement, steel, lumber suppliers)
- Equipment manufacturers (Caterpillar, Komatsu)
- Expected growth: 5-8% annually
2. Smart Building Technology (12-20% returns)
- Building management systems (Siemens, Schneider, Honeywell)
- Energy efficiency technology
- Smart glass, insulation, HVAC
- Expected growth: 10-15% annually
3. Transportation Infrastructure (10-18% returns)
- Toll road operators (Transurban, Atlantia)
- Public transit equipment (Alstom, Bombardier, Siemens)
- Traffic management systems
- Expected growth: 6-10% annually
4. Utilities & Grid (8-15% returns)
- Electric utilities investing in grid modernization
- Water utilities
- Smart meter manufacturers
- Expected growth: 5-8% annually
5. Infrastructure Funds/ETFs (8-12% returns)
- Global Infrastructure Partners
- Brookfield Infrastructure Partners
- Infrastructure ETFs (IGF, IFRA, etc.)
- Expected growth: 6-10% annually
Sample Portfolio:
- 30%: Infrastructure funds (diversified exposure)
- 25%: Smart building technology (high growth)
- 20%: Construction & materials (steady growth)
- 15%: Utilities (defensive, dividend-paying)
- 10%: Transportation infrastructure (long-term)
10-Year Projection: €10,000 @ 12% average = €31,058
Thesis: $94T infrastructure investment wave creates decade+ of construction boom and technology deployment.
Time to complete: 30 minutes
Action: Allocate 10-20% to infrastructure theme
Expected return: 8-20% annually depending on allocation
ACTIVITY 5: The Infrastructure Advocacy Commitment
Commit to infrastructure improvements:
I, _____________, commit to infrastructure advocacy.
My Local Infrastructure Issues:
My Advocacy Actions:
- Monthly: Attend city council or planning meetings
- Quarterly: Contact elected officials about infrastructure
- Annually: Vote for infrastructure funding measures
My Investment Actions:
- Allocate ___% of portfolio to infrastructure
- Support companies prioritizing infrastructure
- Expected return: ___% annually
My Personal Actions:
- Support infrastructure taxes/bonds
- Choose efficient buildings/transit
- Document and report infrastructure problems
My Accountability: Partner: _______________ Quarterly: Review progress Annual: Measure infrastructure improvements
Why this matters: [Write reason – safety, economy, efficiency, future]
Expected Impact:
- Local: Pressure for improvements
- Investment: Profit from infrastructure boom
- System: Better infrastructure benefits everyone
Date: ______ Signature: ______
Time to complete: 15 minutes
Impact: Civic + financial engagement
The Bottom Line: Infrastructure = Foundation of Civilization
Civilization runs on infrastructure. Ours is crumbling. Rebuilding creates $94 trillion opportunity.
The value propositions:
- Infrastructure need: $94 trillion globally through 2040
- Investment returns: 8-35% depending on sector
- Economic benefit: $4-11 return per $1 invested
- Smart infrastructure: 20-40% more efficient
- Job creation: Millions of construction and technology jobs
The crisis is real:
- US infrastructure: C- grade, $2.6T backlog
- Europe: €3T investment gap
- Developing world: $15T infrastructure deficit
- Economic losses: $3.7T by 2040 if not fixed
- Safety risks: Bridge collapses, water contamination, blackouts
The solution:
- Government: Massive infrastructure spending bills
- Private sector: PPPs, infrastructure funds
- Technology: Smart systems improving efficiency
- Investment: Capital flowing to infrastructure assets
- Individuals: Support funding, invest in sector
Infrastructure determines competitiveness, quality of life, and sustainability. Rebuild smart and prosper.
🏗️🚇💧🏥