Why $7-10 Trillion Investment Creates 15-30% Returns While Powering the Planet
ACTIVITY 1: The Renewable Energy Potential Assessment
Calculate renewable potential where you live:
Solar Potential:
- Your location: _______________
- Annual sunshine hours: ___ (1,500-3,000 typical)
- Roof area: ___m² × 0.15 kW/m² = ___kW potential
- Annual production: ___kW × 1,000-1,800 hours = ___kWh
- Value: kWh × €0.15-0.30 = **€/year**
- System cost: kW × €1,500-2,500/kW = €
- Payback: ___years (typically 5-8)
Wind Potential (if applicable):
- Average wind speed: ___m/s (need 5+ for viability)
- Small wind turbine: 5-10 kW (€15,000-30,000)
- Production: 8,000-15,000 kWh/year
- Payback: 8-12 years typically
Community Solar/Wind:
- Investment: €1,000-10,000
- Returns: 5-8% annually
- No roof/land needed
Your Renewable Score:
- Solar viable: Yes/No
- Wind viable: Yes/No
- Community option: Yes/No
- Action plan: _______________
Reality: Renewables now viable almost everywhere. Economics compelling even without climate motivation.
Time to complete: 30 minutes
Cost: Free
What you learned: Your personal renewable energy potential
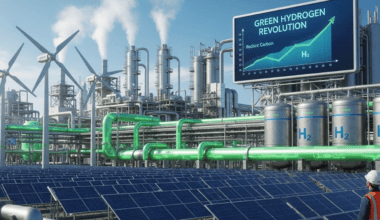
Here’s the renewable reality: Solar and wind are now CHEAPEST electricity sources globally at $30-50/MWh vs $60-150 for fossil fuels. Still dropping 10-15% annually. Growing 15-30% per year. Will supply 70-90% of electricity by 2050. $7-10 trillion investment through 2050 creating 15-30% returns.
The transformation:
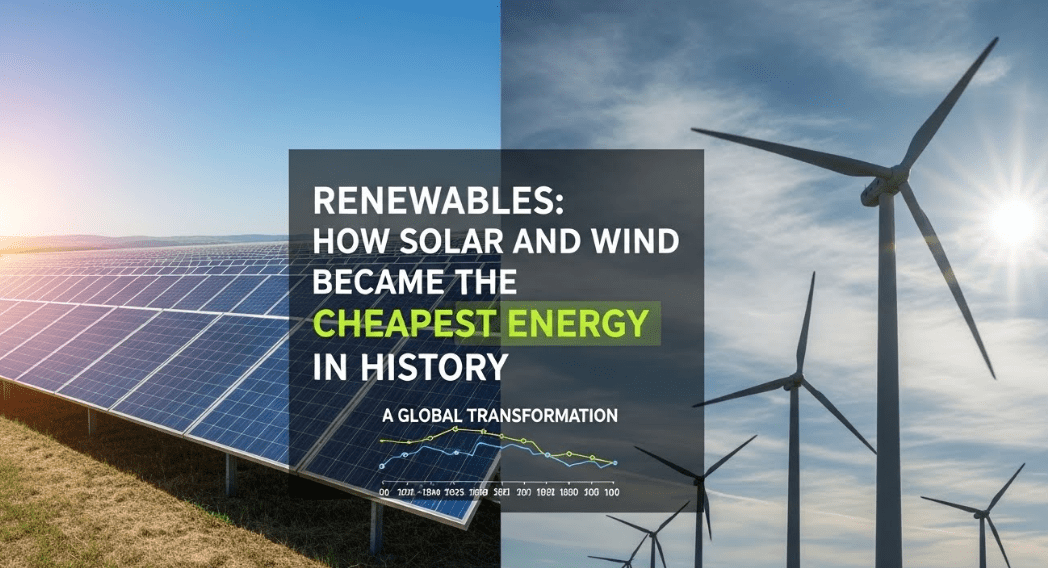
- 2010: Solar $350/MWh (uncompetitive), Wind $130/MWh (marginal)
- 2025: Solar $30-40/MWh (CHEAPEST!), Wind $30-50/MWh (CHEAPEST!)
- 2030: Solar $20-30/MWh (EVEN CHEAPER), Wind $25-40/MWh
- Growth: 20-30% annually solar, 15-20% wind
Result: Renewable energy = inevitable economics, unstoppable deployment, massive investment opportunity.
The Value Proposition: Renewables = Superior Returns
Solar Economics: The Learning Curve
Wright’s Law: Every doubling of cumulative production → 20-28% cost reduction
Solar trajectory:
- 1975: $100/watt (only satellites affordable)
- 2000: $5/watt (early adopters)
- 2010: $1.50/watt (subsidies needed)
- 2025: $0.30/watt (CHEAPEST!)
- 2030: $0.15-0.20/watt (projected)
90%+ cost reduction in 15 years = unprecedented in energy history
Deployment growth:
- 2000: 1 GW globally
- 2010: 40 GW
- 2020: 760 GW
- 2025: 1,500 GW
- 2030: 3,000-5,000 GW (projected)
- 2050: 20,000+ GW
Doubling every 3-4 years = exponential, not linear
Investment returns:
Utility-scale solar farms:
- Cost: $600-900/kW
- Revenue: Power purchase agreements 15-25 years
- Returns: 8-12% (stable, predictable)
Rooftop solar:
- Cost: €1,500-2,500/kW installed
- Savings: €0.15-0.30/kWh × production
- Payback: 5-8 years
- ROI: 12-20% for 25-30 years
Solar stocks:
- First Solar, SunPower, Enphase: 20-40% annual returns (volatile)
- Solar ETFs: 15-25% returns
Wind Economics: Scaling Up
Onshore wind:
- Turbine size: 2 MW (2010) → 5-6 MW (2025) → 7+ MW (2030)
- Cost: $1,000-1,500/kW
- LCOE: $30-50/MWh (competitive everywhere)
- Capacity factor: 35-45% (operating 35-45% of hours)
- Returns: 8-12% for wind farms
Offshore wind:
- Turbine size: 8-10 MW (2020) → 15 MW (2025) → 20+ MW (2030+)
- Cost: $2,500-4,000/kW (dropping fast)
- LCOE: $50-80/MWh (dropping to $40-60 by 2030)
- Capacity factor: 50-60% (steadier wind at sea)
- Returns: 10-15% for offshore wind farms
Why offshore wind special:
- Stronger, steadier winds
- Massive resource (deep ocean previously inaccessible, now with floating)
- Close to coastal demand centers
- Less visual impact (out of sight)
Global potential:
- Onshore: 50,000+ GW technical potential
- Offshore: 200,000+ GW potential (near-unlimited with floating)
Investment:
- Wind stocks: Vestas, Ørsted, Siemens Gamesa: 12-20% returns
- Wind farms: 8-15% returns
- Offshore wind: 10-18% returns (higher due to better resources)
Storage: The Missing Piece
Problem: Solar doesn’t shine at night, wind is variable
Solution: Battery storage (covered in other article, but critical for renewables)
Economics of solar + storage:
- Solar + 4-hour battery: $40-60/MWh all-in LCOE
- Cheaper than gas peaker plants ($60-100/MWh)
- Result: Renewables + storage can provide 24/7 reliable power cheaper than fossil fuels
This changes everything:
- No longer “intermittent” problem
- Can replace fossil baseload
- 100% renewable grids economically viable
ACTIVITY 2: The Renewable Energy ROI Calculator
Compare renewable investment options:
Option 1: Rooftop Solar
- System: 6 kW (€9,000-15,000)
- Incentives: €___ (30-40% typical)
- Net cost: €___
- Annual production: 7,200-10,800 kWh
- Annual savings: €1,080-3,240
- Payback: 4-7 years
- 25-year value: €27,000-81,000
- ROI: 300-600% over life
Option 2: Community Solar
- Investment: €5,000
- Annual return: 6-8%
- No maintenance, no roof needed
- 10-year value: €8,954-10,794
- ROI: 79-116%
Option 3: Solar Stocks
- Investment: €10,000
- Historical: 20-30% annually (volatile)
- 10-year @ 25%: €93,132
- ROI: 831%
Option 4: Wind Farm Investment
- Investment: €10,000 (via fund)
- Returns: 8-12% annually
- 10-year @ 10%: €25,937
- ROI: 159%
Option 5: Renewable Energy ETF
- Investment: €10,000
- Returns: 12-18% annually
- 10-year @ 15%: €40,456
- ROI: 305%
Sample Diversified Portfolio:
- 30%: Rooftop solar (if viable)
- 25%: Solar stocks/ETFs
- 25%: Wind investments
- 20%: Community solar/renewable bonds
€20,000 invested, blended 15% return = €80,911 in 10 years
Time to complete: 30 minutes
Action: Execute renewable investment plan
Expected outcome: 12-30% annual returns
The Technology Revolution: Continuous Innovation
Perovskite Solar Cells
Current silicon solar:
- 22-24% efficiency (commercial)
- Rigid panels
- 25-30 year lifespan
Perovskite solar:
- 28-30% efficiency (lab, improving)
- Flexible (can print on any surface)
- Potentially 30-50% cheaper
- Lightweight
Timeline:
- 2025-2028: First commercial products
- 2030: Mainstream adoption if stability solved
Challenge: Degradation (lifespan currently shorter)
If solved: Could drop solar costs another 30-50%
Tandem Solar Cells
Concept: Stack multiple materials capturing different light wavelengths
Perovskite + silicon tandem:
- 30-35% efficiency (vs 22% single silicon)
- Same form factor
- 20-30% higher output for same area
Timeline: 2028-2032 commercialization
Impact: Makes solar viable even in non-ideal conditions (low sun, limited space)
Floating Solar (Floatovoltaics)
Concept: Solar panels on water (reservoirs, lakes, ocean)
Advantages:
- No land use (keeps land for agriculture/nature)
- Cooling effect improves efficiency 5-10%
- Reduces water evaporation
- Vast potential (millions of hectares of reservoirs globally)
Economics: Slightly more expensive than ground-mount but competitive
Deployment: Growing 50% annually, 5 GW globally (2025)
Agrivoltaics
Concept: Solar panels above crops (dual land use)
Benefits:
- Shade reduces water needs
- Some crops grow better in partial shade
- Farmers get electricity income
- No land sacrifice
Economics: Can be more profitable than farming alone
Floating Offshore Wind
Fixed-bottom offshore wind: Limited to <60m water depth
Floating wind:
- Works in 60-300m+ depth
- Accesses best wind resources (stronger, steadier)
- Opens vast ocean areas (10,000+ GW potential)
- Scales offshore wind 10-20x
Cost: $80-120/MWh (2025) → $50-70/MWh (2030)
Deployment:
- <1 GW (2025)
- 20+ GW (2030)
- 300+ GW (2050)
Game-changer for countries with deep coastlines (US West Coast, Japan, etc.)
ACTIVITY 3: The 30-Day Renewable Energy Challenge
Go 100% renewable in 30 days:
Week 1: Assess & Switch
- Day 1-3: Complete Activity 1 (renewable potential)
- Day 4-5: Research renewable electricity providers
- Day 6-7: Switch to 100% renewable electricity (often €0-5/month premium!)
Week 2: Solar Planning
- Day 8-10: Get 3 solar quotes if homeowner
- Day 11-13: Calculate ROI using Activity 2
- Day 14: Decide: Install solar or join community solar
Week 3: Efficiency First
- Day 15-17: Reduce electricity use 15-25% (efficiency maximizes solar value)
- Day 18-20: Shift usage to daytime when solar producing (if solar)
- Day 21: Optimize for renewable electricity
Week 4: Invest & Advocate
- Day 22-24: Invest €1,000-10,000 in renewable sector
- Day 25-27: Advocate for renewable policies
- Day 28-30: Share journey #100RenewableChallenge
Expected Results:
- Electricity: 100% renewable (€0-60/year premium)
- Solar plan: Decided and scheduled
- Efficiency: 15-25% reduction
- Investment: €___ positioned for renewable boom
- Emissions: 80-100% electricity emissions eliminated
Share: #RenewableEnergyChallenge
Time commitment: 1-2 hours daily
Financial impact: Often savings + investment returns
Climate impact: 2-4 tons CO₂ eliminated annually
The Crisis Reality: Fossil Fuels Can’t Compete
Cost Crossover Achieved
Historic moment: 2020-2023 globally, solar/wind became cheaper than fossils
New build costs (2025):
- Solar: $30-40/MWh (CHEAPEST)
- Wind: $30-50/MWh (CHEAPEST)
- Natural gas: $55-75/MWh
- Coal: $95-115/MWh
- Nuclear: $130-200/MWh
Result: No new fossil plants economically justified
Existing plants:
- Some continue operating (already paid for)
- But retiring early as cheap renewables available
- Coal plants especially (highest operating costs)
Pattern: Build solar/wind, close coal. Economics + climate aligned.
Grid Integration Challenges (Being Solved)
Myth: “Renewables can’t power grid reliably”
Reality: Multiple solutions combining:
1. Geographic diversity: Wind/solar different locations smooth output
2. Overcapacity: Build 150% of average demand, always have enough
3. Storage: Batteries for hours, hydro for days, hydrogen for weeks
4. Demand response: Shift flexible loads to when renewables producing
5. Transmission: Connect regions (sun somewhere, wind somewhere)
6. Backup: Natural gas (short-term), hydrogen (long-term) for rare gaps
Result: Studies show 80-90% renewable grids feasible, 100% possible with storage
Cost: Comparable to fossil fuel grid when including health/environmental costs
Renewables Growing Faster Than All Forecasts
IEA has underestimated renewables for 20 years:
Solar example:
- 2010 IEA forecast for 2020: 200 GW
- Actual 2020: 760 GW (3.8x!)
- 2015 IEA forecast for 2025: 500 GW
- Likely actual 2025: 1,500 GW (3x!)
Pattern: Exponential growth repeatedly exceeds linear forecasts
Implication: 2030-2050 deployment will massively exceed current projections
ACTIVITY 4: The Renewable Energy Investment Portfolio
Complete renewable portfolio:
Investment Options:
1. Diversified Renewable ETF (12-18% returns)
- ICLN, TAN, QCLN, others
- Broad exposure
- Lower risk than individual stocks
2. Solar Manufacturers (20-40% returns, volatile)
- First Solar, SunPower, Enphase
- High growth potential
- Technology/policy risk
3. Wind Companies (12-20% returns)
- Vestas, Ørsted, Siemens Gamesa
- Established, growing
- Offshore wind boom
4. Renewable Utilities (8-15% returns + dividends)
- NextEra Energy, Iberdrola, Enel
- Stable cash flows
- Dividend income
5. Rooftop Solar/Community Solar (12-20% returns)
- Direct ownership
- Tangible assets
- Local impact
Sample Portfolio:
- 30%: Rooftop/community solar (tangible + local)
- 25%: Solar manufacturers (high growth)
- 20%: Wind companies (diversification)
- 15%: Renewable utilities (stability + dividends)
- 10%: Renewable ETFs (broad exposure)
€20,000 total investment Blended return: 16% annually 10-year value: €87,735
Time to complete: 30 minutes
Action: Build complete renewable portfolio
Expected return: 12-30% annually
ACTIVITY 5: The Renewable Energy Commitment
Commit to 100% renewable energy:
I, _____________, commit to renewable energy.
My Current Energy:
- Electricity: ___kWh annually
- % Renewable: ___%
- Cost: €___ annually
My 2-Year Goals:
- Switch to 100% renewable electricity: ✓ (Year 1)
- Install solar or join community solar: ✓ (Year 2)
- Invest €___ in renewable sector: ✓ (Years 1-2)
- Reduce consumption 20%: ✓ (ongoing)
My Actions:
- Month 1: Switch to renewable electricity provider
- Months 2-6: Get solar quotes, plan installation
- Months 7-12: Install solar or join community solar
- Year 2: Optimize usage, additional investments
My Investment:
- Total renewable investment: €___
- Expected return: __% annually
- 10-year value: €___ → €___
My Advocacy:
- Support renewable energy policies
- Educate ___ people about renewable economics
- Vote for climate action
My Accountability: Partner: _______________ Quarterly: Energy production/consumption, investment returns Annual: Progress toward 100% renewable
Why this matters: [Write reason – economics, climate, energy independence, future]
Expected 2-Year Results:
- 100% renewable electricity
- Solar producing: ___kWh annually
- Investment value: Up 25-50%
- Emissions: 80-100% from electricity eliminated
- Savings: €___/year
Date: ______ Signature: ______
Time to complete: 15 minutes
Impact: Personal transformation + support $7-10T transition
The Bottom Line: Renewable Energy Revolution Unstoppable
Solar and wind are now cheapest electricity sources in history. Costs still dropping 10-15% annually. Growing 15-30% per year. Will dominate global electricity by 2050. This is inevitable economics, unstoppable momentum.
The value propositions:
- Cost: $30-50/MWh (CHEAPEST globally)
- Growth: 15-30% annually
- Investment: $7-10 trillion through 2050
- Returns: 12-30% for investors
- Storage: Batteries solving intermittency
The crisis is real:
- Climate: Must rapidly displace fossil fuels
- Fossil plants: Becoming uneconomic
- Stranded assets: $1-4 trillion at risk
- Air pollution: Kills millions annually
The solution:
- Scale renewables: From 30% to 70-90% of electricity
- Deploy storage: Batteries + other solutions
- Upgrade grids: Transmission + smart systems
- Invest: Capital flowing to renewables
- Policy: Remove fossil subsidies, support renewables
Renewable energy wins on economics alone. Climate benefits are bonus. Most important investment theme of 2025-2050.
☀️💨⚡