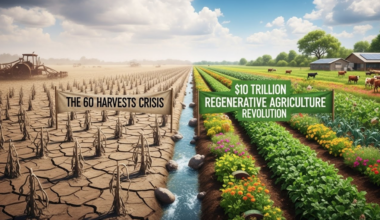
Why Oil, Gas, and Coal Assets Will Become Worthless While Renewables Create Wealth
ACTIVITY 1: The Fossil Fuel Dependency Reality Check
Track everything you do in one day that uses fossil fuels:
Morning:
- Hot shower (natural gas heater): ✓
- Drive/bus to work (gasoline/diesel): ✓
- Breakfast (food transported by trucks): ✓
Daytime:
- Office/home electricity (50-70% fossil fuel globally): ✓
- Heating/cooling (mostly natural gas): ✓
- All products used (manufactured with fossil energy): ✓
- Transportation (fossil fuels): ✓
Evening:
- Cooking (natural gas or electricity from fossil): ✓
- Products consumed (plastics, packaging = petroleum): ✓
- More transportation: ✓
Count fossil fuel touchpoints in your day: 20-50+
Reality: Modern life is 80-90% dependent on fossil fuels. But this is changing fast. Within 30 years, most of these touchpoints will shift to clean energy. And trillions in fossil fuel assets will become worthless.
Time to complete: 24 hours of awareness
Cost: Free
What you learned: Fossil fuel dependence is total, but temporary
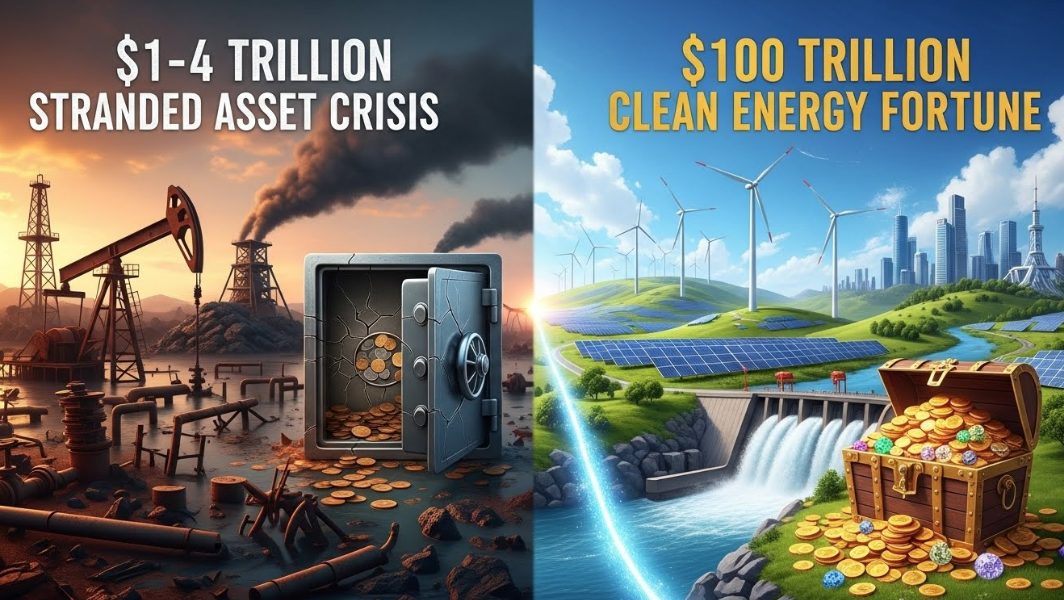
Here’s the fossil fuel endgame: Demand will peak 2025-2030 then decline irreversibly. $1-4 trillion in fossil assets will become stranded (worthless before fully depreciated). Meanwhile, $100 trillion flows into clean energy through 2050 creating largest wealth transfer in history.
The physics: Renewables now cheaper than fossil fuels in most locations. Cost advantage growing yearly. Once cheaper alternative exists, expensive incumbent dies. This is inevitable.
Fossil fuels made fortunes for 150 years. Clean energy will make bigger fortunes over next 30.
The Value Proposition: Divest Fossil, Invest Clean = Massive Returns
The Stranded Asset Crisis
What are stranded assets? Resources (coal reserves, oil wells, gas fields, refineries, power plants, pipelines) that lose value before end of economic life due to changing economics or regulations.
Fossil Fuel Stranded Asset Estimates:
- Conservative: $1 trillion (proven reserves uneconomical below $40/barrel oil)
- Moderate: $2-3 trillion (2°C scenario, most reserves unburnable)
- Aggressive: $4+ trillion (1.5°C scenario, rapid transition)
Who Gets Hurt:
- Oil majors: Shell, BP, ExxonMobil, Chevron holding worthless reserves
- Coal companies: Already experiencing bankruptcies (Peabody, Murray Energy, others)
- Utilities: Coal/gas power plants shut early
- Investors: Pension funds, sovereign wealth funds holding fossil stocks
Timeline:
- Coal: Stranding happening now (plants closing early globally)
- Oil: Stranding begins 2025-2030 as EV adoption accelerates
- Natural gas: Stranding begins 2030-2040 (bridge fuel buying time)
The Pattern: Assets bought expecting 20-40 year lifespan becoming worthless in 10-20 years as cheaper alternatives emerge.
The Clean Energy Wealth Creation
$100 Trillion Investment Through 2050:
- Solar: $30-40 trillion
- Wind: $20-30 trillion
- Grid infrastructure: $15-20 trillion
- Energy storage: $10-15 trillion
- EVs and charging: $10-15 trillion
- Hydrogen: $5-10 trillion
- Other (heat pumps, efficiency, etc.): $10-15 trillion
Who Wins:
- Renewable energy companies: NextEra, Ørsted, Vestas, First Solar
- EV makers: Tesla, BYD, others
- Battery companies: CATL, LG Energy, Samsung SDI
- Grid technology: Smart grid, transmission companies
- Clean tech investors: Early movers capturing 15-30% annual returns
Historical Parallel: Transition from horses to cars (1900-1930) created massive wealth for early auto investors while horse/buggy makers went bankrupt. Same pattern repeating.
ACTIVITY 2: The Fossil Fuel Exposure Audit
Calculate your financial exposure to stranded assets:
Direct Holdings:
- Oil/gas company stocks: €___
- Coal company stocks: €___
- Fossil fuel bonds: €___
- Fossil-heavy index funds: €___
Indirect Holdings (check your):
- Pension fund fossil exposure: % × total = €_
- 401k/retirement fossil exposure: % × total = €_
- Insurance company investments: Unknown (but likely 5-15%)
Total Fossil Exposure: €___
Stranded Asset Risk:
- At 50% loss: €___ × 0.5 = €___ potential loss
- At 70% loss: €___ × 0.7 = €___ potential loss
Compare to Clean Energy Exposure:
- Renewable energy stocks/funds: €___
- EV company stocks: €___
- Clean tech: €___
- Total Clean Exposure: €___
Ratio:
- Fossil vs Clean: ___ : ___
- Recommended: Move from 70/30 fossil/clean to 30/70 over 5-10 years
Time to complete: 30 minutes
Insight: You likely have significant fossil exposure at risk
Action: Begin reallocation to clean energy
The Technology Revolution: Renewables Win on Economics
Cost Curves: Renewables Crushing Fossils
Levelized Cost of Energy (LCOE) – $/MWh:
2010:
- Coal: $90-100
- Natural gas: $60-80
- Solar: $350-400 (uncompetitive!)
- Wind: $130-150 (uncompetitive!)
2025:
- Coal: $95-115 (rising due to regulations)
- Natural gas: $55-75
- Solar: $30-40 (70-90% cost reduction!)
- Wind: $30-50 (60-70% cost reduction!)
Projection 2030:
- Coal: $100-150 (stranded)
- Natural gas: $50-80 (declining)
- Solar: $20-30 (continued decline)
- Wind: $25-40 (continued decline)
Result: Renewables now cheapest electricity source in most locations. Gap widening yearly as solar/wind costs continue falling while fossil costs flat to rising.
Why This Matters: Once renewables cheaper, no new fossil plants built. Existing plants retired early as cheaper to build new solar/wind than operate existing coal/gas. This is death spiral for fossils.
Technology Improvements Accelerating
Solar:
- Efficiency: 15% (2010) → 22% (2024) → 30%+ (2030 projected)
- Lifespan: 20 years → 30+ years
- Cost: $4/watt → $0.30/watt (90%+ reduction)
Wind:
- Turbine size: 3 MW → 15+ MW offshore
- Capacity factor: 30% → 50%+ (operating more hours)
- Cost: $2M/MW → $1M/MW
Batteries:
- Cost: $1,000/kWh (2010) → $150/kWh (2024) → $50/kWh (2030 projected)
- Density: Improving 5-7% annually
- Lifespan: 1,000 cycles → 3,000+ cycles
EVs:
- Range: 100 miles → 300+ miles
- Charging: Hours → 20-30 minutes (fast charging)
- Cost: Price parity with gas cars achieved 2024-2025
The Pattern: Technology improvements + scale = cost reductions + performance improvements = fossil fuels obsolete.
ACTIVITY 3: The Divestment Calculator
Calculate returns from divesting fossil, investing clean:
Scenario: Reallocate €10,000
Option A: Keep in Fossil Fuels (2025-2035)
- Expected return: 2-5% annually (declining industry)
- 10-year value: €12,190-16,290
- Stranded asset risk: 30-50% loss possible
- Risk-adjusted return: €6,100-11,400
Option B: Shift to Clean Energy (2025-2035)
- Expected return: 12-18% annually (growing rapidly)
- 10-year value: €31,060-52,340
- Risk: Lower (growing industry, policy support)
Difference:
- Best case: €36,050 more with clean (52,340 vs 16,290)
- Worst case: €18,870 more with clean (31,060 vs 12,190)
- Risk-adjusted: €19,660-46,240 more with clean
Plus:
- Environmental benefit: Supporting clean transition
- No stranded asset risk
- Alignment with policy direction (subsidies, mandates favor clean)
Divest/Invest Strategy:
- Year 1-2: Shift 30% from fossil to clean
- Year 3-5: Shift another 30%
- Year 6-10: Shift final portion as comfortable
- Result: Gradual transition minimizing timing risk
Time to complete: 20 minutes
Action: Begin divestment from fossil fuels
Expected benefit: 2-4x better returns over 10 years
The Crisis Reality: Peak Oil Demand Approaching
Demand Peak 2025-2030
Multiple forecasts converging on oil demand peak this decade:
IEA (International Energy Agency):
- Demand peaks before 2030 in all scenarios
- Declines 25% by 2050 (stated policies)
- Declines 75% by 2050 (net-zero scenario)
OPEC (Optimistic):
- Demand peaks 2035-2040
- Slight decline thereafter
BloombergNEF:
- Demand peaks 2025-2028
- Rapid decline as EVs scale
Consensus: Peak 2025-2030, decline thereafter.
Drivers:
- EVs: Displacing 2-5 million barrels/day oil by 2030
- Efficiency: Vehicles getting more efficient
- Behavior change: Remote work, less driving
- Alternatives: Biofuels, hydrogen for aviation/shipping
Result: Oil majors preparing for peak by diversifying or shrinking.
Coal Already Collapsing
Coal demand peaked 2014 globally:
- Developed world: Rapid decline (US, Europe down 50-70%)
- China: Peaked 2013, declining slowly
- India: Still growing but slower than expected
- New plants: Almost none being built (globally 90% reduction in new plants)
Coal companies: Wave of bankruptcies (Peabody 2x, Murray Energy, others). Investors losing billions. Mines closing.
Stranded assets: $300-500 billion in coal plants globally closing early.
Natural Gas: The Last Man Standing
Natural gas seen as “bridge fuel” – cleaner than coal, flexible for grid balancing with renewables.
But: Bridge to nowhere if renewables + batteries cheaper than gas:
- Battery storage costs falling 10-15% annually
- By 2030: Batteries + renewables cheaper than gas peaker plants
- By 2035: Cheaper than gas baseload plants
- Result: Gas demand peaks 2030-2040 then declines
Stranded asset risk: $500-1,000 billion in gas infrastructure if decline faster than expected.
ACTIVITY 4: The 30-Day Fossil Fuel Reduction Challenge
Reduce personal fossil fuel consumption:
Week 1: Transportation
- Day 1-3: Track transportation emissions (car, bus, etc.)
- Day 4-5: Try alternatives (bike, walk, carpool, public transit)
- Day 6-7: Calculate savings (money + CO₂)
Week 2: Home Energy
- Day 8-10: Audit home energy use, identify fossil sources
- Day 11-13: Improve efficiency (insulation, LED, thermostat)
- Day 14: Research renewable energy options (solar, green electricity)
Week 3: Consumption
- Day 15-17: Reduce purchases (less stuff = less manufacturing = less fossil fuels)
- Day 18-20: Choose low-carbon products where possible
- Day 21: Calculate total fossil fuel reduction so far
Week 4: Investment
- Day 22-24: Complete Activity 2 (Fossil Fuel Exposure Audit)
- Day 25-27: Begin divestment from fossil fuels
- Day 28-30: Invest in clean energy alternatives
Expected Results:
- Transportation emissions: Reduced 20-40%
- Home energy: Reduced 15-25%
- Consumption: Reduced 20-30%
- Investment: Reallocated 20-50% to clean
- Total fossil fuel reduction: 25-35%
- Money saved: €100-400 monthly
Share: #FossilFuelReduction
Time commitment: 30-60 min daily
Financial benefit: €100-400 monthly + better investment returns
Climate impact: 2-4 tons CO₂ reduced annually
ACTIVITY 5: The Clean Energy Commitment
Commit to the transition:
I, _____________, commit to divesting from fossil fuels and investing in clean energy.
My Current Situation:
- Fossil fuel investments: €___
- Clean energy investments: €___
- Annual fossil fuel consumption: ___ tons CO₂
My 5-Year Goals:
- Reduce fossil investments: 70%
- Increase clean investments: 3-5x
- Reduce fossil consumption: 50%
- Support clean energy policies
My Actions:
- Year 1: Shift 30% from fossil to clean
- Year 2: Shift another 20%
- Year 3: Shift final 20%
- Year 4-5: Optimize clean portfolio
My Accountability: Partner: _______________ Annual review: Portfolio allocation Public: Share journey #CleanEnergyTransition
Why this matters: [Write reason – climate, investment returns, future, values]
Expected Outcomes:
- Investment returns: 10-15% annually (vs 2-5% fossil)
- Portfolio growth: 2-3x over 10 years
- Climate impact: Massive CO₂ reduction
- Legacy: Invested in future not past
Date: ______ Signature: ______
Time to complete: 15 minutes
Impact: Better returns + climate action
The Bottom Line: Fossil Fuels = Sunset Industry, Clean Energy = Sunrise
Fossil fuels powered civilization for 150 years. But their time is ending. Not because they ran out—because something better emerged.
The value propositions:
- Clean energy: $100 trillion investment opportunity through 2050
- Returns: 10-20% annually in growing clean sector vs 2-5% in declining fossil sector
- Stranded assets: $1-4 trillion in fossil assets becoming worthless
- Cost advantage: Renewables now cheaper, gap widening
- Policy support: Subsidies, mandates, regulations favoring clean
The crisis is real:
- Peak oil demand: 2025-2030
- Coal collapsed: Already declining globally
- Gas next: Peaks 2030-2040
- Stranded assets: Trillions at risk
- Investor losses: Already happening in coal, coming for oil/gas
The solution:
- Divest: Gradually shift from fossil to clean (over 5-10 years)
- Invest: Clean energy, EVs, batteries, grid, efficiency
- Reduce: Personal fossil fuel consumption
- Advocate: Support clean energy policies
- Profit: Capture massive wealth transfer from fossil to clean
The clean energy transition is happening. It’s driven by economics, not just environment. Position accordingly and profit while saving planet.
⚡🔋🌞