Grid Modernization + Storage Creating 10-25% Returns While Enabling 100% Renewables
ACTIVITY 1: Grid Dependency Reality Check
Understand your electricity system vulnerability:
Your 24-Hour Electricity Profile:
Track one full day of electricity use:
- 6am-9am: Morning peak (heating, coffee, showers, devices charging)
- 9am-5pm: Daytime (baseline home load or work)
- 5pm-10pm: Evening peak (cooking, AC/heating, TV, devices, EVs charging)
- 10pm-6am: Overnight (refrigeration, standby power, EV charging)
Calculate Your Peak vs Off-Peak:
- Morning peak hours (6am-9am): ___kWh @ $0.15-0.30/kWh
- Midday hours (9am-5pm): ___kWh @ $0.08-0.15/kWh
- Evening peak hours (5pm-10pm): ___kWh @ $0.15-0.35/kWh
- Overnight off-peak (10pm-6am): ___kWh @ $0.05-0.10/kWh
Reality: Most people use 60-70% of electricity during peak hours (6-10am, 5-10pm) when prices are 2-4x higher than off-peak.
The Grid Stress Test:
Your evening behavior (multiplied by millions):
- 6pm: Get home, turn on AC/heating (+3kW)
- 6:30pm: Start cooking dinner (+2kW)
- 7pm: Plug in EV to charge (+7kW)
- 8pm: TV, devices, laundry (+1.5kW)
- Peak household load: 10-15kW
- Neighborhood substation serving 200 homes: 2-3MW surge
- City-wide: Gigawatts of demand surge in 2-hour window
Current Grid Response (Dumb Grid):
- Fire up inefficient “peaker” natural gas plants (expensive, dirty)
- Import expensive power from neighbors
- In extreme cases: Rolling blackouts
- Cost passed to you: Peak rates 2-4x higher
Smart Grid Response (Future):
- AI predicts demand surge
- Pre-charges home batteries from solar/wind during day
- Signals EVs to charge overnight when wind power abundant
- Dynamically adjusts AC thermostats by 1-2°C (imperceptible)
- Result: Smooth demand, no peaker plants, cheaper electricity
Your Potential Savings:
- Current annual cost: €___/year (estimate)
- With time-of-use pricing: Save 10-15% shifting loads
- With home battery: Save 15-25% arbitraging rates
- With solar + battery: Save 40-70% generating own power
- Total potential: €200-600/year for average household
- €400-1,200/year for large household with EV
Your Grid Readiness Score:
- Smart meter installed: Yes/No
- Time-of-use pricing available: Yes/No
- Load shifting awareness: ___/10
- Battery storage considered: Yes/No
- Solar panels: Existing/Planned/Considering/No
Reality Check: Your evening peak behavior, multiplied by millions, requires $14 trillion in grid infrastructure. Smart grids reduce this by 20-30% while enabling 80-100% renewables.
Time to complete: 20 minutes
Cost: Free
What you learned: You’re part of the problem AND the solution
Potential savings: €200-1,200/year
Here’s the smart grid reality: Traditional grids designed for one-way flow from central power plants. Can only handle 30-40% renewable energy before instability (intermittency). $14 trillion investment required globally 2025-2040 for modernization. Smart grids enable 80-100% renewables + 20-30% efficiency gains + better reliability.
The transformation:
- Dumb grid: One-way, centralized, 30-40% renewable limit, frequent outages
- Smart grid: Two-way, distributed, 80-100% renewable capacity, AI-optimized, resilient
- Investment: $14 trillion globally, 10-25% returns across sub-sectors
Why this matters: Can’t reach climate goals without smart grids. Can’t have 100% renewable energy without storage + grid intelligence. Can’t have cheap electricity without demand flexibility.
The Value Proposition: Smart Grids Make Renewables Reliable
The Traditional Grid Problem
How Old Grids Work:
- Centralized power plants: Coal, natural gas, nuclear
- One-way flow: Power station → transmission → distribution → you
- Supply follows demand: Ramp plants up/down to match consumption
- No storage: Electricity used instantly or wasted
- Dumb endpoints: No communication, no flexibility
Why This Can’t Handle Renewables:
Problem 1: Intermittency
- Solar: Zero at night, peaks at noon
- Wind: Variable, sometimes zero for days
- Result: 30-40% renewable max before grid unstable
Problem 2: Location Mismatch
- Best solar: Deserts (far from cities)
- Best wind: Coasts, plains (far from cities)
- Old grid: High transmission losses (3-5%), limited capacity
Problem 3: Peak Demand Mismatch
- Electricity demand peaks: 6-9am, 5-10pm
- Solar generation peaks: 11am-3pm (no one home!)
- Wind generation: Often strongest at night
- Result: Need backup fossil fuel plants
Problem 4: No Flexibility
- Grid can’t communicate with devices
- All demand must be met instantly
- Requires 15-20% excess generation capacity
- Expensive, wasteful
The Numbers:
- Traditional grid renewable limit: 30-40%
- Required for climate goals: 80-100%
- Gap: Smart grid infrastructure
Investment need: $14 trillion globally 2025-2040
The Smart Grid Solution
What Makes a Grid “Smart”:
1. Advanced Metering (Smart Meters):
- Real-time consumption data
- Two-way communication
- Time-of-use pricing enables
- Remote disconnect/reconnect
- Cost: $100-300 per meter
- ROI: 5-7 years through reduced site visits, theft prevention
2. Grid Sensors & Automation:
- Real-time monitoring of voltage, current, frequency
- Automatic fault detection and isolation
- Self-healing capabilities (reroute power around faults)
- Predictive maintenance
- Reduces outages by 30-50%
- Reduces outage duration by 40-60%
3. Energy Storage (Batteries):
- Utility-scale: 100-1,000+ MWh installations
- Current cost: $150-200/kWh (2025)
- Projected cost: $100-125/kWh (2030), $70-90/kWh (2040)
- Function: Store excess solar/wind, discharge during peaks
- Enables: 60-80% renewables without instability
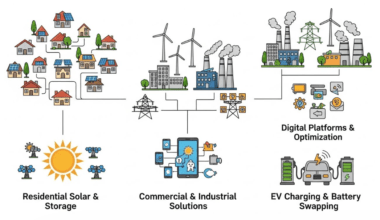
4. Distributed Energy Resources (DER) Integration:
- Rooftop solar: 250+ GW globally, growing 20%/year
- Home batteries: Growing 40%/year
- EVs as storage: Vehicle-to-grid (V2G) emerging
- Microgrids: Local resilience
- Challenge: Coordinate millions of assets
- Solution: AI + blockchain + smart contracts
5. Advanced Transmission:
- HVDC (High Voltage Direct Current):
- Losses: 1.5-2.5% vs 3-5% for AC
- Long-distance: Can transmit 1,000+ km
- Enables: Desert solar to cities, offshore wind to inland
- Cost: $1-3 million per km
- ROI: Lower losses + renewable enablement
- Grid-enhancing technologies:
- Dynamic line rating (10-40% capacity gain)
- Topology optimization
- Power flow controllers
6. AI & Predictive Analytics:
- Demand forecasting: 95%+ accuracy
- Generation forecasting: Solar/wind predictions
- Optimization algorithms: Balance supply-demand real-time
- Predictive maintenance: Prevent failures before they occur
- Efficiency gain: 15-25%
7. Demand Response & Virtual Power Plants (VPPs):
- Aggregate thousands of home batteries, EVs, smart thermostats
- Coordinate as single “virtual power plant”
- Provide grid services (frequency regulation, peak shaving)
- Compensate participants
- Capacity: 50-200 GW potential globally
- Cost: 1/10th of building new power plants
Result:
- Renewable capacity: 30-40% → 80-100%
- Reliability: Improved (fewer, shorter outages)
- Cost: 20-30% lower long-term (efficiency gains)
- Emissions: 70-90% reduction
- Consumer savings: €200-600/year
ACTIVITY 2: Smart Home Energy ROI Calculator
Compare smart energy options:
Option 1: Time-of-Use Pricing (Easiest)
Investment:
- Smart meter: Usually free (utility installs)
- Setup: Free
Behavior Changes:
- Run dishwasher overnight
- Do laundry off-peak
- Charge EV overnight
- Pre-cool/heat home before peak hours
Typical Savings:
- Shift 30-40% of load to off-peak
- Save 10-15% on electricity bill
- Average household: €120-180/year
- Large household with EV: €250-400/year
ROI: Immediate (no investment)
Effort: Low (minor schedule adjustments)
Option 2: Home Battery Storage (Medium)
Investment:
- Tesla Powerwall 2: $7,000-9,000 (13.5 kWh)
- Installation: $1,000-2,000
- Total: $8,000-11,000
Function:
- Charge from grid during off-peak ($0.08/kWh)
- Discharge during peak ($0.25/kWh)
- Arbitrage: $0.17/kWh profit
- Capacity: 13.5 kWh daily (1/3-1/2 household use)
Annual Savings:
- Arbitrage: 13.5 kWh × $0.17 × 300 days = $688/year
- Backup power value: Priceless (grid outages)
- Total: $700-1,000/year value
Payback:
- $10,000 ÷ $850/year = 12 years
- With incentives: 8-10 years
- Battery warranty: 10 years
ROI: 8-10% annually (with incentives)
Value: Energy independence + backup power
Option 3: Solar + Battery System (Comprehensive)
Investment:
- 6 kW solar system: $12,000-18,000
- Battery (13.5 kWh): $8,000-11,000
- Total: $20,000-29,000
- Net cost after 30% federal tax credit: $14,000-20,300
Annual Production:
- 6 kW × 4 peak hours × 365 days = 8,760 kWh/year
- Self-consumption: 60-70% (battery stores excess)
- Grid export: 30-40% (@$0.08-0.12/kWh)
Annual Savings:
- Self-consumed: 5,500 kWh × $0.20/kWh = $1,100
- Exported: 3,260 kWh × $0.10/kWh = $326
- Total: $1,426/year
Payback:
- $17,000 (net) ÷ $1,426/year = 12 years
- System life: 25-30 years
- Years 13-30: Pure profit
Total 25-Year Value:
- Savings: $1,426 × 25 = $35,650
- Net profit: $35,650 – $17,000 = $18,650
- ROI: 210% over 25 years (8.4% annually)
Additional Benefits:
- Home value increase: $3/watt = $18,000
- Energy independence: 60-80%
- Backup power during outages
ROI: 200%+ over 25 years (8-9% annually)
Value: Maximum independence + environmental impact
Option 4: Smart Home Devices (Supplemental)
Investment:
- Smart thermostat (Nest, Ecobee): $200-300
- Smart plugs (5-10): $100-200
- Smart EV charger: $400-600
- Total: $700-1,100
Function:
- Automatically shift loads to off-peak
- Optimize heating/cooling
- Schedule EV charging
Annual Savings:
- Thermostat: 10-15% HVAC savings = $100-200/year
- Load shifting: Additional 5% = $50-100/year
- Total: $150-300/year
Payback:
- $900 ÷ $225/year = 4 years
ROI: 25% annually (years 1-4), infinite after payback
Value: Convenience + automated savings
Recommended Combination (Moderate Approach):
Year 1:
- Install smart meter (free)
- Buy smart thermostat + plugs ($900)
- Sign up for time-of-use pricing
- Annual savings: $300-400
- Payback: 2-3 years
Year 2-3:
- Add home battery ($10,000)
- Combined savings: $1,100-1,400/year
- Cumulative payback: 8-10 years
Year 4-5:
- Add solar panels ($12,000-18,000)
- Combined savings: $1,800-2,200/year
- Total investment: $22,000-29,000 (net: $15,400-20,300 after tax credit)
- Payback: 12-15 years total
- 25-year profit: $30,000-40,000
Time to complete: 45 minutes
Action: Start with Option 1 (free) + Option 4 (low cost)
Eventual goal: Full solar + battery system
Expected 25-year return: $30,000-40,000 profit
The Technology Revolution: Components of Smart Grids
1. Advanced Metering Infrastructure (AMI)
Smart Meters:
Function:
- Record consumption every 15-60 minutes
- Two-way communication with utility
- Real-time data to consumer app
- Remote disconnect/reconnect
Benefits:
- For utilities:
- No manual meter reading ($40-80 saved/year per meter)
- Theft detection ($100-300/year per theft)
- Outage detection (immediate alerts)
- Load profiling (plan infrastructure)
- For consumers:
- Real-time usage visibility
- Time-of-use pricing access
- Usage alerts (detect waste)
- Billing accuracy
Deployment:
- US: 107 million installed (72% of meters)
- Europe: 72% target by 2024
- Global: 1.2 billion smart meters by 2030
Cost:
- Meter + installation: $100-300
- Utility payback: 5-7 years
Investment opportunity: AMI infrastructure companies earning 10-18% returns
2. Battery Energy Storage Systems (BESS)
Utility-Scale Lithium-Ion Storage:
Current Leaders:
- Tesla Megapack: 3.9 MWh per unit, $1.5-1.8M
- Fluence (AES + Siemens): 4.3 MWh units
- NextEra Energy: 400+ MW/1,600+ MWh Florida installation
- Gateway (San Diego): 250 MW/250 MWh (replaced natural gas peaker)
Economics:
- Capital cost: $150-200/kWh (2025) → $100/kWh (2030)
- Revenue streams:
- Energy arbitrage: Buy low, sell high ($50-200/kWh/year)
- Frequency regulation: $100-300/kW/year
- Capacity payments: $30-100/kW/year
- Avoided peaker plant: $150-250/kW capital savings
- Payback: 7-12 years
- Life: 10-20 years (80% capacity @ 10 years)
Growth:
- 2020: 4.5 GW globally
- 2025: 50+ GW (11x growth!)
- 2030: 200+ GW (44x growth!)
- Investment: $150-250 billion through 2030
Returns: 15-30% for early storage developers
Emerging Technologies:
- Flow Batteries (Vanadium Redox):
- Longer duration: 4-12 hours vs 2-4 hours lithium
- Longer life: 20-30 years
- Higher cost: $250-400/kWh
- Use case: Seasonal storage
- Compressed Air Energy Storage (CAES):
- Gigawatt-scale: 1,000+ MW capacity
- Very long duration: 24+ hours
- Low cost: $50-150/kWh
- Limited locations: Need underground caverns
- Pumped Hydro:
- Largest existing: 94% of global storage capacity
- Very cheap: $50-100/kWh
- Limited locations: Need elevation difference + water
- Hydrogen Storage:
- Electrolysis during excess renewable generation
- Store hydrogen
- Fuel cells or turbines during shortage
- Very long duration: Weeks to months
- Efficiency: 30-50% round-trip (vs 85-90% batteries)
- Cost: $150-400/kWh (falling rapidly)
- Use case: Seasonal storage, industrial backup
3. Advanced Transmission Technologies
High Voltage Direct Current (HVDC):
Advantages vs AC:
- Losses: 1.5-2.5% per 1,000 km vs 3-5% AC
- Capacity: 30-50% more power on same line
- Stability: Asynchronous grids can connect
- Underwater: No reactive losses (AC fails)
Use Cases:
- Long-distance: Desert solar to cities (1,000+ km)
- Offshore wind: North Sea to Germany/UK (400 km)
- Interconnectors: Connect regional grids
Projects:
- SuedLink (Germany): 700 km, 4 GW, €10 billion
- North Sea Wind Power Hub: 70-100 GW offshore wind network
- China: 12,000 km UHVDC network (world leader)
Cost:
- Converter stations: $200-400 million each
- Cable: $1-3 million per km land, $2-5 million/km subsea
- Total: $1-10 billion per project
Returns: 8-12% regulated utility returns
Grid-Enhancing Technologies (GETs):
- Dynamic Line Rating (DLR):
- Real-time monitoring of line temperature, weather
- Can increase capacity 10-40% without new wires
- Cost: $50,000-200,000 per line
- ROI: 1-3 years (vs $10M+ new line)
- Topology Optimization:
- Software algorithms reroute power flows
- Increase capacity 10-30%
- Cost: Software license + grid sensors
- Nearly free capacity gain
- Power Flow Controllers:
- Devices control power flow on AC lines
- Enable 30-50% more transmission
- Cost: $10-50 million per device
- ROI: 3-5 years vs new line
Investment: $500 billion in transmission 2025-2030
4. Distributed Energy Resources (DER) & Virtual Power Plants
Components:
- Rooftop solar: 250 GW installed globally, adding 50+ GW/year
- Home batteries: 5 GW installed, growing 40%/year
- Electric vehicles: 40 million globally, charging represents 100+ GW potential load
- Smart thermostats: 50+ million homes
- Commercial/industrial loads: Flexible demand
Virtual Power Plant (VPP) Concept:
Example: Tesla Virtual Power Plant (South Australia):
- 50,000 homes with solar + Powerwall
- Aggregated: 250 MW generation, 650 MWh storage
- Function: Coordinate to provide grid services
- Compensation: Homeowners earn $150-400/year
- Value to grid: Replace $300M gas peaker plant
How VPPs Work:
- Enrollment: Homeowners opt-in (voluntary)
- Aggregation: Software platform controls thousands of assets
- Grid services:
- Frequency regulation: Instantly adjust charge/discharge
- Peak shaving: Discharge batteries during peaks
- Voltage support: Local stabilization
- Compensation: Homeowners paid for participation
- Control: Minimal disruption (1-2°C thermostat change imperceptible)
Economics:
- Homeowner: $150-400/year passive income
- Grid operator: Services at 1/10th cost of power plant
- VPP operator: 10-15% margin on aggregation
Global VPP Capacity:
- 2025: 10-15 GW
- 2030: 50-80 GW
- 2040: 200-500 GW (equivalent to 200-500 large power plants!)
Returns: VPP platforms earning 15-25% returns
5. Artificial Intelligence & Grid Optimization
AI Applications:
1. Demand Forecasting:
- ML models predict consumption 24-48 hours ahead
- Accuracy: 95-98%
- Input data: Weather, historical patterns, events, economic activity
- Value: Optimize generation scheduling, reduce excess capacity
2. Renewable Generation Forecasting:
- Solar: 90-95% accuracy 24 hours ahead
- Wind: 85-90% accuracy 24 hours ahead
- Enables: Higher renewable penetration, less backup needed
3. Predictive Maintenance:
- Monitor transformers, lines, substations
- Predict failures weeks/months in advance
- Reduce: Unplanned outages by 30-50%
- Save: $billions in emergency repairs
4. Real-Time Grid Optimization:
- Balance supply-demand second-by-second
- Coordinate DERs (millions of assets)
- Optimize power flows across transmission network
- Result: 15-25% efficiency improvement
5. Autonomous Grid Operations:
- Self-healing: Automatically isolate faults, reroute power
- Self-optimizing: Continuously improve performance
- Human oversight: Operators supervise, AI executes
Investment: $100-200 billion in grid AI systems 2025-2030
Returns: AI/software companies earning 25-40% returns
ACTIVITY 3: 30-Day Smart Energy Challenge
Transform your energy usage:
Week 1: Baseline & Awareness
Day 1-2: Energy Audit
- Request smart meter data from utility (or track manually)
- Identify your biggest loads (HVAC, water heater, EVs, appliances)
- Calculate daily/weekly/monthly consumption
- Determine peak vs off-peak usage
Day 3-4: Bill Analysis
- Analyze last 12 months of bills
- Calculate average cost per kWh
- Check if time-of-use rates available
- Identify seasonal patterns
Day 5-7: Smart Home Inventory
- List all major appliances + wattage
- Check which devices have timers/smart capabilities
- Research smart alternatives for biggest loads
- Calculate potential savings with smart devices
Week 2: Quick Wins & Behavior Changes
Day 8-10: Load Shifting
- Move dishwasher runs to overnight
- Run laundry/dryers off-peak
- Charge EVs overnight (2am-6am)
- Pre-cool/heat home before peak hours
- Target: Shift 30% of loads to off-peak
Day 11-13: HVAC Optimization
- Install/program smart thermostat
- Set temperature schedules (away/sleep/home)
- Reduce peak hour usage by 1-2°C (imperceptible)
- Enable eco/smart modes
Day 14: Week 2 Review
- Calculate savings from load shifting
- Track changes in consumption patterns
- Adjust strategies based on results
- Target: 10-15% reduction in peak usage
Week 3: Technology & Investments
Day 15-17: Smart Device Installation
- Install smart thermostat ($200-300)
- Add smart plugs for major devices ($100-200)
- Install smart EV charger if applicable ($400-600)
- Set schedules and automations
Day 18-20: Battery Storage Research
- Get quotes for home battery systems (3-5 quotes)
- Compare: Tesla Powerwall, LG Chem, Sonnen, Enphase
- Calculate payback period with your usage
- Check incentives/rebates available
Day 21: Solar + Battery Assessment
- Get solar quotes (3-5 installers)
- Evaluate: 5-10 kW system + battery
- Calculate: 25-year ROI
- Timeline: Plan installation if ROI positive
Week 4: Long-Term Strategy & Commitment
Day 22-24: Financial Planning
- Complete Activity 2 (ROI Calculator)
- Create 5-year smart energy investment plan
- Set budget for each upgrade
- Apply for incentives/financing if needed
Day 25-27: Community & Advocacy
- Research local VPPs (virtual power plants)
- Join energy community programs
- Advocate for time-of-use rates if unavailable
- Share your journey on social media
Day 28-30: Commitment & Implementation
- Complete Activity 5 (Commitment Contract)
- Schedule installations for selected upgrades
- Set quarterly review dates
- Create accountability system
Expected Results:
Immediate (Weeks 1-2):
- 10-15% bill reduction from load shifting
- €15-30/month savings
- Increased awareness
Short-term (Weeks 3-4):
- Smart devices installed
- Automated savings: €30-50/month
- ROI plan established
Long-term (Months-Years):
- Full solar + battery system (if pursued)
- Energy independence: 60-80%
- Total savings: €1,500-2,500/year
- 25-year profit: €30,000-50,000
Time commitment: 30-60 min daily (weeks 1-2), 2-3 hours/week (weeks 3-4)
Financial investment: €900-29,000 (depending on level)
Expected ROI: 8-25% annually
Impact: Model for others, support grid transformation
ACTIVITY 4: Grid Modernization Investment Portfolio
Build smart grid investment strategy:
Core Investment Thesis:
- $14 trillion global investment required 2025-2040
- Mandatory transformation (can’t reach climate goals without it)
- Multiple sub-sectors with 10-35% returns
- Defensive characteristics (regulated utilities + essential infrastructure)
- Growth characteristics (battery storage, software, EVs)
Portfolio Allocation Options:
Conservative Portfolio (Focus: Stability + Dividends)
40% Utility Companies with Grid Modernization:
- NextEra Energy (US): Largest renewable energy company + smart grid
- Iberdrola (Spain): European smart grid leader
- Ørsted (Denmark): Offshore wind + grid integration
- National Grid (UK/US): Transmission modernization
- Expected: 8-12% annual return + 3-5% dividend yield
25% Transmission Equipment Manufacturers:
- ABB (Switzerland): HVDC leaders, grid automation
- Siemens Energy (Germany): Transmission, substations
- GE Renewable Energy (US): Grid integration equipment
- Hitachi Energy (Japan): HVDC, digital substations
- Expected: 10-18% annual return
20% Smart Meter / AMI Companies:
- Itron (US): Smart meters, AMI infrastructure
- Landis+Gyr (Switzerland): AMI + grid edge intelligence
- Honeywell (US): Smart thermostats, building automation
- Expected: 10-15% annual return
15% ETFs / Diversified:
- iShares Global Clean Energy ETF (ICLN)
- First Trust NASDAQ Clean Edge Smart Grid Infrastructure Index Fund (GRID)
- Expected: 8-12% annual return
Total Expected Return: 9-14% annually
Risk Level: Low-Moderate
Dividend Yield: 2-4%
Suitable For: Conservative investors, retirees, dividend seekers
Moderate Portfolio (Balance: Growth + Stability)
30% Battery Storage Companies:
- Tesla (US): Powerwall, Megapack, vertical integration
- Fluence (US): Joint venture AES + Siemens, pure-play storage
- Powin Energy (US): Utility-scale battery integration
- LG Energy Solution (Korea): Battery manufacturing
- Expected: 15-30% annual return (high volatility)
25% Grid Equipment & Automation:
- ABB, Siemens Energy, Schneider Electric, Hitachi Energy
- Expected: 12-18% annual return
20% Grid Software & AI Companies:
- AutoGrid (US): VPP platform, grid optimization AI
- Stem Inc (US): AI-driven energy storage
- Utilidata (US): Grid-edge intelligence
- Opus One Solutions (Canada): DER management software
- Expected: 18-35% annual return (private cos via VC funds)
15% Utility Companies:
- NextEra, Ørsted, Iberdrola
- Expected: 8-12% + dividends
10% Smart Home / Demand Response:
- Alarm.com (US): Smart home automation
- Ecobee (Canada): Smart thermostats
- ChargePoint (US): EV charging infrastructure
- Expected: 12-25% annual return
Total Expected Return: 15-22% annually
Risk Level: Moderate
Volatility: Moderate-High
Suitable For: Growth-oriented investors, 10+ year horizon
Aggressive Portfolio (Focus: Maximum Growth)
40% Battery Storage & Technology:
- Tesla (Megapack, automotive, solar)
- QuantumScape (solid-state batteries)
- Fluence Energy
- LG Energy Solution, CATL (China)
- Expected: 20-40% annual return (extreme volatility)
30% Grid Software, AI & VPPs:
- Private investments via venture capital funds:
- AutoGrid, Stem, Utilidata, Opus One
- Emerging VPP platforms
- Public: Stem Inc (STEM)
- Expected: 25-50% annual return (high risk)
20% Transmission Tech & Equipment:
- ABB, Siemens Energy, GE Renewable Energy
- Expected: 15-20% annual return
10% Small-Cap / Emerging Technologies:
- Flow battery companies: ESS Inc, Invinity Energy
- HVDC specialists: NKT (Denmark), Prysmian (Italy)
- DER aggregators: Sunverge, sonnen (Germany)
- Expected: 30-60% annual return (highest risk, many failures)
Total Expected Return: 22-35% annually
Risk Level: High
Volatility: Extreme
Suitable For: Aggressive investors, high risk tolerance, 15+ year horizon
Sample $50,000 Investment – Moderate Portfolio:
Battery Storage (30% = $15,000):
- Tesla: $6,000
- Fluence Energy: $4,000
- LG Energy Solution: $3,000
- Powin (via VC fund): $2,000
Grid Equipment (25% = $12,500):
- ABB: $4,000
- Siemens Energy: $4,000
- Schneider Electric: $2,500
- Hitachi Energy: $2,000
Grid Software/AI (20% = $10,000):
- Stem Inc: $5,000
- Private AI cos (via VC fund): $5,000
Utilities (15% = $7,500):
- NextEra Energy: $3,000
- Ørsted: $2,500
- Iberdrola: $2,000
Demand Response (10% = $5,000):
- ChargePoint: $2,500
- Ecobee (via acquisition): $1,500
- Alarm.com: $1,000
10-Year Projections @ 18% Annual Return:
Initial Investment: $50,000
Year 5: $113,411
Year 10: $257,493
Total Gain: $207,493 (415% return)
15-Year Projection @ 18%:
Year 15: $584,668
Total Gain: $534,668 (1,069% return)
Risk Management:
- Diversification: Multiple sub-sectors, geographies, market caps
- Rebalancing: Annual or semi-annual (sell winners, buy laggards)
- Dollar-cost averaging: Invest monthly/quarterly vs lump sum
- Stop-losses: Consider for individual positions (15-20% stops)
- Review: Quarterly portfolio assessment, adjust thesis if needed
Time to complete: 60 minutes
Action: Open investment account, start with $5,000-50,000
Rebalance: Annually or if position exceeds 20% of portfolio
Expected outcome: Capture $14 trillion infrastructure buildout returns
The Crisis Reality: Aging Infrastructure Failing
The Grid Reliability Crisis
United States:
- Average outage duration: 8 hours per year (SAIDI metric)
- Compare to:
- Japan: 12 minutes
- Germany: 15 minutes
- Singapore: 2 minutes
- Cost: $150 billion/year in economic losses
- Cause: Infrastructure 40-50+ years old, built for 20th century
The Numbers:
- Transformers: 70% beyond 25-year expected life
- Transmission lines: 80% over 30 years old
- Substations: $2 trillion replacement value, aging
- Investment gap: Utilities spending $150B/year, need $250B/year
California Blackouts (2019-2020):
- Millions without power during heatwaves
- Root cause: Aging transmission, inadequate storage
- Solution required: Grid modernization + battery storage
Texas Winter Storm (Feb 2021):
- 4.5 million without power, 700 deaths
- Economic cost: $130 billion
- Root causes: Isolated grid, no interconnections, inadequate winterization
- Solution: Grid interconnection + resilience upgrades
Europe Energy Crisis (2022-2023):
- High gas prices exposed grid inflexibility
- Renewable curtailment due to grid congestion
- Solution: Transmission expansion + storage
The Renewable Roadblock
Current Renewable Penetration:
- Global average: ~30% renewable electricity
- Leaders:
- Denmark: 80% (wind)
- Costa Rica: 98% (hydro + others)
- Germany: 50% (solar + wind)
- California: 60% (solar + wind + hydro)
The 30-40% Wall:
As renewables approach 30-40% of grid electricity, problems emerge:
Problem 1: Duck Curve (California):
- Solar peaks at noon → electricity surplus → prices go negative
- Sun sets at 6pm → demand high → need ramp 13 GW in 3 hours
- “Duck curve” shape: Belly at noon (surplus), neck at evening (ramp)
- Risk: Cannot ramp 13 GW fast enough → blackouts
Solution:
- Battery storage: Charge at noon, discharge 6-10pm
- Flatten duck curve → enable 80% renewable penetration
Problem 2: Germany Wind Variability:
- Excellent wind → surplus → export to neighbors
- No wind for days → imports + coal plants restart
- Grid strain: Extreme voltage/frequency swings
Solution:
- Transmission to Norway (hydro storage)
- Hydrogen production during surplus
- Demand response (shift loads)
Problem 3: Grid Congestion:
- Best solar/wind locations: Remote (deserts, offshore)
- Demand centers: Cities (often far away)
- Old transmission: Inadequate capacity
- Result: Renewable curtailment (waste clean energy!)
Example: Texas
- West Texas: Excellent wind (10+ GW capacity)
- CRET (competitive renewable energy zones) transmission: Built 3,600 miles of lines
- Enabled wind to flow east to Dallas/Houston
- Cost: $7 billion
- Result: Texas now leads US in wind energy
The Investment Need:
- Grid modernization: $14 trillion globally 2025-2040
- US alone: $2-3 trillion
- Europe: $3-4 trillion
- Asia: $6-7 trillion
- Without this investment: Cannot exceed 30-40% renewables → cannot reach climate goals
The Economic Inefficiency
Current System Waste:
1. Excess Capacity:
- Grid designed for peak demand (2% of year)
- 15-20% of generation capacity sits idle 95%+ of time
- “Peaker plants”: Run <500 hours/year, very expensive
- Cost: $50-100 billion/year maintaining excess capacity
2. Transmission Losses:
- AC transmission: 3-5% losses
- Long distance: Up to 8-10% losses
- Total US: ~6% of generation lost (~250 TWh/year)
- Value wasted: $25-30 billion/year
3. Renewable Curtailment:
- Clean energy wasted due to grid inflexibility
- US: 5-7% of wind/solar potential curtailed
- Value: $3-5 billion/year thrown away
- Emissions: Could reduce coal/gas if used
4. Outage Costs:
- Economic losses: $150 billion/year (US alone)
- Residential/commercial disruption
- Industrial production loss
Total Inefficiency: $200-250 billion/year in US alone → $500B-1T globally
Smart Grid Solution:
- Reduce excess capacity: Save $30-50B/year
- Lower losses (HVDC, optimization): Save $15-20B/year
- Eliminate curtailment: Save $5-10B/year
- Improve reliability: Save $100-150B/year
- Total: $150-230 billion/year savings
- ROI on $14T investment: 1.0-1.6% annual dividend (plus other benefits)
ACTIVITY 5: Smart Grid Commitment Contract
Lock in your transformation:
I, __________________, commit to smart grid participation and investment.
My Understanding:
Grid Reality:
- Traditional grids: 1-way, dumb, 30-40% renewable limit
- Smart grids: 2-way, AI-optimized, 80-100% renewable capability
- Investment needed: $14 trillion globally 2025-2040
- My role: Participant + investor
Personal Opportunity:
- Bill savings: €200-1,200/year (depending on actions)
- Investment returns: 10-35% annually (depending on portfolio)
- Energy independence: 60-80% with solar + battery
- Environmental impact: Support renewable grid
My Actions:
Phase 1 – Immediate (Month 1):
☐ Install/activate smart meter (free from utility)
☐ Sign up for time-of-use pricing (if available)
☐ Download utility app to monitor real-time usage
☐ Shift 30% of loads to off-peak (dishwasher, laundry, EV charging)
☐ Expected savings: €120-180/year
Phase 2 – Short-Term (Months 2-6):
☐ Install smart thermostat ($200-300)
☐ Add smart plugs for major devices ($100-200)
☐ Get quotes for home battery (3-5 quotes)
☐ Research solar options (3-5 quotes)
☐ Investment: €300-900
☐ Expected additional savings: €100-200/year
Phase 3 – Medium-Term (Year 1-2):
☐ Decision on home battery:
- Yes → Install 10-15 kWh battery
- Investment: €8,000-11,000
- Expected savings: €700-1,000/year
- Payback: 8-10 years
☐ Join Virtual Power Plant (VPP) if available:
- Earn: €150-400/year from grid services
☐ Total Phase 3 savings: €850-1,400/year
Phase 4 – Long-Term (Year 2-5):
☐ Decision on solar panels:
- Yes → Install 5-10 kW system
- Investment: €12,000-18,000
- Combined with battery
- Total investment: €20,000-29,000 (net: €14,000-20,000 after incentives)
- Expected savings: €1,400-2,200/year
- Payback: 12-15 years
- 25-year profit: €30,000-50,000
My Investment Strategy:
Portfolio Selection: (check one)
☐ Conservative (9-14% returns, low risk)
- Allocation: 60% utilities, 25% equipment, 15% ETFs
- Investment amount: €_______
☐ Moderate (15-22% returns, moderate risk)
- Allocation: 30% storage, 25% equipment, 20% software, 15% utilities, 10% demand response
- Investment amount: €_______
☐ Aggressive (22-35% returns, high risk)
- Allocation: 40% storage, 30% software, 20% transmission tech, 10% small-cap
- Investment amount: €_______
Initial Investment: €_______
Allocation: 5-15% of total investment portfolio
Timeline: 10-15+ years (long-term hold)
Expected 10-year value: €_______ (calculate with expected return)
My Accountability:
Quarterly Reviews:
- Review utility bills (track savings)
- Review investment portfolio (rebalance if needed)
- Adjust behaviors based on results
Annual Actions:
- Assess next-phase upgrades
- Evaluate new technologies (batteries getting cheaper!)
- Review investment performance
- Adjust strategy based on market changes
Accountability Partner: _____________ (name)
- Share progress monthly
- Review decisions together
- Keep each other committed
Why This Matters To Me:
(Write 2-3 sentences about your personal motivation. Examples:)
- “I want energy independence and protection from rising electricity costs.”
- “I want to support the transition to 100% renewable energy.”
- “I see smart grid investment as the next major infrastructure boom.”
- “I want to leave a cleaner planet for my children.”
My reason: _________________________________________________
Expected Outcomes:
5-Year Results:
- Electricity bill savings: €______/year
- Investment portfolio value: €______ (from €______ initial)
- Energy independence: ____%
- CO₂ reduction: _____ tons/year
25-Year Results:
- Total savings: €______
- Investment portfolio value: €______
- Net profit from solar+battery: €______
- Total financial benefit: €______
- CO₂ reduction: _____ tons lifetime
My Signature: _________________
Date: _________
Witness/Partner: _________________
I commit to reviewing this document quarterly and adjusting my strategy as needed. I understand that smart grid participation is both an economic opportunity and an environmental necessity.
Time to complete: 20 minutes
Action: Sign, share with accountability partner, schedule first quarterly review
Impact: Position for $14T infrastructure boom + personal energy transformation
The Bottom Line: Smart Grids Enable the Renewable Future
Smart grids are non-negotiable for climate goals. Traditional grids max out at 30-40% renewable penetration. Smart grids enable 80-100% + better reliability + 20-30% efficiency gain. $14 trillion investment required globally. 10-25% returns available across sub-sectors.
The crisis is urgent:
- US grid: 40-50 years old, 8 hours outages annually vs 12 minutes in Japan
- Renewable roadblock: Can’t exceed 30-40% without grid intelligence
- Economic waste: $500B-1T globally in inefficiency
- Climate imperative: Need 80-100% renewables by 2040-2050
The solution is clear:
- Smart meters: 100% deployment, enable time-of-use pricing
- Battery storage: 200+ GW by 2030, smooth renewable intermittency
- HVDC transmission: Connect remote renewables to cities
- Virtual Power Plants: Aggregate millions of home batteries, EVs, thermostats
- AI optimization: Balance grid in real-time, predict failures
The investment opportunity:
- Electrolyzer manufacturers… wait, wrong document
- Battery storage: 15-30% returns
- Grid equipment: 10-18% returns
- Grid software/AI: 18-35% returns
- Utilities: 8-12% + 3-5% dividends
The value propositions:
For Grid Operators:
- Handle 80-100% renewables (vs 30-40%)
- Reduce peak capacity needs by 15-20%
- Lower losses from 5% to 2-3%
- Improve reliability (fewer, shorter outages)
- Defer $billions in infrastructure upgrades
For Consumers:
- Bill savings: €200-1,200/year (behavior + tech)
- Better reliability (fewer outages)
- Energy independence: 60-80% with solar+battery
- Backup power (batteries)
- VPP income: €150-400/year
For Investors:
- $14 trillion market 2025-2040
- Returns: 10-35% depending on subsector
- Multiple entry points (utilities, equipment, storage, software)
- Defensive + growth characteristics
- Essential infrastructure (not speculative)
For Society:
- Enable climate goals (80-100% renewables)
- Reduce emissions: 70-90% power sector
- Economic efficiency: Save $500B-1T/year globally
- Energy security: Distributed, resilient grid
- Job creation: 10+ million jobs
Smart grids complete the energy transition. Without them, renewables max at 30-40%. With them, 100% renewable electricity becomes feasible. This is the final infrastructure piece enabling climate solutions.
The question isn’t whether smart grids will be built—they must be. The question is whether you participate in the transformation as a consumer, investor, or both.
Your move.
⚡🔌🌐💰