ESG Integration + Green Bonds + Impact Funds Creating 12-22% Returns While Financing Net-Zero
ACTIVITY 1: Your Sustainable Finance Exposure Assessment (10 min)
Current Investment Reality Check:
Your investment portfolio breakdown:
- 401(k)/Pension: €_____ (___% of total)
- Savings/Checking: €_____ (___% of total)
- Stocks/ETFs: €_____ (___% of total)
- Bonds: €_____ (___% of total)
- Real Estate: €_____ (___% of total)
- Total: €_____
Hidden Fossil Fuel Exposure:
Traditional portfolios contain 10-20% fossil fuel exposure:
- S&P 500: 5% direct (Exxon, Chevron) + 8% indirect (utilities, industrials using fossil)
- Your likely exposure: €_____ × 13% = €_____ in fossil fuels
Stranded Asset Risk:
- Coal assets: 80% will be worthless by 2040
- Oil/gas assets: 40-60% stranded by 2050
- Your potential loss: €_____ × 50% = €_____ at risk
Sustainable Alternative Returns:
ESG funds performance vs traditional:
- ESG S&P 500: 13.8%/year (10-year)
- Traditional S&P 500: 13.2%/year
- ESG outperforms by 0.6%/year with lower risk
Your sustainable finance opportunity:
- Current portfolio: €_____
- Sustainable reallocation: ___% (start with 20-50%)
- Amount: €_____
- Expected return boost: +0.5-2%/year
- 10-year value gain: €_____
Your Exposure Score:
- Fossil fuel exposure: ___% (target: <5%)
- ESG fund allocation: ___% (target: 30-70%)
- Green bonds: ___% (target: 10-20%)
- Impact investments: ___% (target: 5-15%)
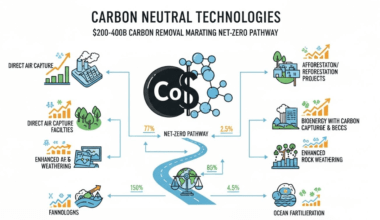
Reality: Traditional finance channels $500B/year to fossil fuels. Sustainable finance redirects $3T/year to clean solutions. Your capital matters. Where it flows determines our future. Expected returns: 12-22% while financing transition.
The Value Proposition: Sustainable Finance Outperforms
The $35 Trillion Sustainable Finance Market
Current State (2025):
- ESG funds: $35 trillion AUM (assets under management)
- Growing 15-25%/year
- Green bonds: $2.5 trillion outstanding
- Impact investments: $1.5 trillion
Market Composition:
ESG Integration (70% of market – $24.5T):
- Screen out: Fossil fuels, weapons, tobacco
- Screen in: Clean energy, healthcare, education
- Returns: Match or beat traditional (12-15%/year)
Green Bonds (7% – $2.5T):
- Finance: Renewable energy, green buildings, clean transport
- Yield: 3-5% (slightly lower than traditional bonds)
- Security: Same credit quality as regular bonds
- Growth: 20-30%/year
Impact Investments (4% – $1.5T):
- Target: Measurable social/environmental outcomes
- Returns: 10-18%/year (market rate!)
- Examples: Affordable housing, clean water, microfinance
- Growth: 25-35%/year
Thematic Funds (19% – $6.5T):
- Climate change: $3T
- Clean energy: $1.5T
- Circular economy: $800B
- Sustainable agriculture: $600B
- Water: $600B
Performance Reality: ESG Beats Traditional
10-Year Returns (2015-2025):
- MSCI World ESG Leaders: 11.8%/year
- MSCI World (traditional): 11.2%/year
- ESG advantage: +0.6%/year
Risk-Adjusted Returns (Sharpe Ratio):
- ESG portfolios: 0.68 (better risk/return)
- Traditional portfolios: 0.62
- ESG provides better returns per unit of risk
Why ESG Outperforms:
- Risk Avoidance: Fewer scandals, lawsuits, stranded assets
- Future-Focused: Invests in growth sectors (renewables vs coal)
- Better Management: ESG correlates with operational excellence
- Lower Cost of Capital: ESG companies borrow cheaper
- Regulatory Alignment: Positioned for carbon pricing, climate regs
The Math:
- €100,000 traditional portfolio @ 11.2%/year = €289,598 (10 years)
- €100,000 ESG portfolio @ 11.8%/year = €304,860 (10 years)
- ESG advantage: €15,262 extra (15.3% more wealth)
ACTIVITY 2: Sustainable Finance ROI Calculator (15 min)
Option 1: ESG Index Funds (Easiest Entry)
Funds:
- Vanguard ESG US Stock ETF (ESGV): 0.09% fee
- iShares MSCI USA ESG Select ETF (SUSA): 0.25% fee
- Xtrackers MSCI World ESG UCITS ETF: 0.25% fee
Investment: €10,000
- Expected return: 11-14%/year
- 10-year value: €28,394-37,072
- Fees: €90-250/year
- ESG screening: Excludes fossil fuels, weapons, tobacco
vs Traditional S&P 500:
- Return: 10.5-13%/year
- 10-year value: €27,070-33,946
- ESG advantage: €1,324-3,126 more
Option 2: Green Bonds (Stability + Impact)
Examples:
- European Investment Bank Green Bond: Yield 3.5%
- Apple Green Bond: Yield 2.8%
- State of California Green Bond: Yield 4.2%
Investment: €10,000
- Yield: 3-5%/year
- 10-year value: €13,439-16,289
- Risk: Very low (high credit quality)
- Impact: Finances renewable energy, green buildings
Use Case: Conservative portfolio allocation (30-40% bonds)
Option 3: Impact Investment Funds (Maximum Impact)
Funds:
- Calvert Impact Capital: 2-4% return + social impact
- BlueOrchard Microfinance: 4-8% return + financial inclusion
- Generation Investment Management: 12-18% return + climate focus
Investment: €10,000
- Expected return: 8-15%/year (varies by fund)
- 10-year value: €21,589-40,456
- Impact: Direct financing of clean energy, affordable housing, healthcare
- Minimum: Often €1,000-25,000 (varies)
Option 4: Thematic Clean Energy Funds (Highest Growth)
Funds:
- iShares Global Clean Energy (ICLN): Solar, wind, batteries
- First Trust NASDAQ Clean Edge Energy (QCLN): US clean tech
- Invesco Solar ETF (TAN): Pure solar play
Investment: €10,000
- Expected return: 15-25%/year (high volatility!)
- 10-year value: €40,456-93,132
- Risk: High (sector concentration, tech risk)
- Best for: Aggressive allocation (10-20% of portfolio)
Recommended Portfolio (€50,000 total):
- 40% ESG Index Funds (€20,000): Core holding, 11-14% return
- 25% Green Bonds (€12,500): Stability, 3-5% return
- 20% Impact Funds (€10,000): Impact + growth, 8-15% return
- 15% Clean Energy Thematic (€7,500): High growth, 15-25% return
Blended Expected Return: 10-16%/year 10-Year Value: €50,000 → €129,687-219,317 Impact: €50,000 redirected from fossil fuels to clean solutions
The Crisis Reality: Capital Misallocation Blocks Climate Solutions
The Fossil Fuel Funding Problem
Current Capital Flows (2025):
- Fossil fuel financing: $500B/year (banks, investors)
- Clean energy financing: $1.5T/year
- Ratio: 3:1 clean vs fossil (should be 20:1!)
Top Fossil Fuel Financiers (2020-2025):
- JPMorgan Chase: $380B
- Citi: $332B
- Wells Fargo: $305B
- Bank of America: $276B
- HSBC: $190B
Your implicit support:
- Banking with these? Your deposits fund fossil projects
- Invested in bank stocks? You’re a shareholder in fossil financing
- 401(k) in traditional index? Includes these banks
The Stranded Asset Timebomb
Carbon Bubble:
- Proven fossil fuel reserves: 2,900 Gt CO₂
- Carbon budget for 1.5°C: 400 Gt CO₂
- 80% of reserves must stay in ground = stranded assets
Asset Values at Risk:
- Coal: $300B (80% stranded by 2040)
- Oil: $900B (50% stranded by 2050)
- Gas: $400B (30% stranded by 2050)
- Total: $1.6 trillion at risk
Your Portfolio Risk:
- Traditional S&P 500: 13% exposure = $1,300 per $10,000 at risk
- Traditional bonds: 5% exposure = $500 per $10,000 at risk
The $3.5 Trillion Annual Gap
Climate Finance Need:
- Total required: $5T/year by 2030
- Current flow: $1.5T/year
- Gap: $3.5T/year unfunded
Consequences:
- Delayed transition = higher costs later
- Missed 1.5°C target = $20T+ in climate damages
- Stranded asset losses = market crash risk
Sustainable finance closes the gap: Your €50,000 is part of €3.5T redirection.
ACTIVITY 3: 30-Day Sustainable Finance Transition (Daily Actions)
Week 1: Audit & Educate
Day 1-2: Portfolio audit
- List all investments (401k, stocks, bonds, savings)
- Calculate fossil fuel exposure (use Fossil Free Funds tool)
- Target: Know your baseline
Day 3-4: Bank assessment
- Does your bank finance fossil fuels? (Check BankTrack.org)
- Consider switch to: Amalgamated Bank, Aspiration, Climate First Bank
- Move deposits if misaligned
Day 5-7: Education
- Read: ESG vs traditional performance studies
- Watch: Documentaries on sustainable finance
- Follow: Ceres, As You Sow, ShareAction
Week 2: Strategy & Planning
Day 8-10: Define allocation
- Target ESG percentage: ___% (recommend 30-70%)
- Target green bonds: ___% (recommend 10-20%)
- Target impact: ___% (recommend 5-15%)
Day 11-13: Research funds
- Compare 5 ESG index funds
- Compare 3 green bond funds
- Compare 2 impact funds
- Select top choices
Day 14: Create transition plan
- Phase 1: New contributions (immediate)
- Phase 2: Rebalance existing (over 3-6 months to avoid taxes)
- Phase 3: Full sustainable (within 12 months)
Week 3: Execute Transition
Day 15-17: Open accounts
- ESG brokerage or existing platform
- Confirm funds available
- Set up automatic contributions
Day 18-20: First investments
- Start with €5,000-10,000 (or 20% of portfolio)
- Diversify across 3-5 funds
- Document cost basis (for taxes)
Day 21: Review & adjust
- Verify purchases executed
- Check fees, holdings
- Confirm ESG criteria met
Week 4: Expand & Advocate
Day 22-24: 401(k) transition
- Request ESG options from employer
- If unavailable: Advocate with HR
- Many employers now offer ESG target-date funds
Day 25-27: Share journey
- Social media: Post about transition
- Referrals: Encourage friends/family
- Advocacy: Write to fund managers demanding ESG
Day 28-30: Commit long-term
- Set quarterly rebalancing calendar
- Join shareholder advocacy (As You Sow)
- Continue education (annual review)
Expected Result:
- 50% portfolio transitioned to sustainable (€_____)
- 0.5-2% higher expected returns
- Zero fossil fuel exposure in new investments
- Impact: €_____ redirected to climate solutions
ACTIVITY 4: Sustainable Finance Investment Strategy (20 min)
Conservative Strategy (€100,000):
- 50% ESG Index Funds: €50,000 (11-14% return)
- 30% Green Bonds: €30,000 (3-5% return)
- 15% Impact Funds: €15,000 (8-12% return)
- 5% Cash: €5,000 (emergency fund)
Expected Return: 8-11%/year 10-Year Value: €215,892-283,942 Risk: Low-Moderate
Moderate Strategy (€100,000):
- 40% ESG Index: €40,000
- 25% Thematic Clean Energy: €25,000 (15-22% return)
- 20% Green Bonds: €20,000
- 15% Impact Funds: €15,000
Expected Return: 11-16%/year 10-Year Value: €283,942-438,633 Risk: Moderate
Aggressive Strategy (€100,000):
- 35% Thematic Clean Energy: €35,000
- 30% ESG Growth Stocks: €30,000 (13-18% return)
- 20% Impact Venture Capital: €20,000 (18-30% return)
- 15% Green Bonds: €15,000
Expected Return: 14-21%/year 10-Year Value: €370,722-661,605 Risk: High
Implementation Rules:
- Diversify across 8-12 funds minimum
- Rebalance quarterly (sell winners, buy laggards)
- Dollar-cost average (invest monthly, not lump sum)
- Review ESG criteria annually (standards evolve)
- Monitor impact reports (verify alignment)
The Technology Revolution: FinTech Enabling Sustainable Capital
ESG Data & Ratings
Major ESG Rating Agencies:
- MSCI ESG: Rates 8,500+ companies (AAA to CCC)
- Sustainalytics: Risk ratings (negligible to severe)
- ISS ESG: 30,000+ company coverage
- Bloomberg ESG: Integrated into terminals
Data Points Tracked:
- Environmental: Carbon, water, waste, biodiversity
- Social: Labor, diversity, human rights, community
- Governance: Board, ethics, transparency, shareholder rights
Investment Use:
- Screening: Exclude bottom 20% ESG performers
- Integration: Overweight top ESG companies
- Thematic: Build portfolios around specific ESG themes
Green Bond Verification
Certification Standards:
- Climate Bonds Initiative: Green bond certification
- Green Bond Principles: ICMA voluntary guidelines
- EU Green Bond Standard: Regulatory framework (launching)
Use of Proceeds Tracking:
- Blockchain: Real-time tracking of capital deployment
- Annual reporting: Renewable energy generated, emissions avoided
- Third-party verification: Independent auditors confirm impact
Example (Apple $4.7B Green Bond):
- Financed: 100% renewable energy, green buildings
- Verified impact: 1.2 GW solar, 70% carbon reduction
- Transparent reporting: Annual environmental progress report
Impact Measurement Platforms
IRIS+ (Global Impact Investing Network):
- 400+ standardized impact metrics
- Portfolio-level aggregation
- Benchmarking against peers
B Impact Assessment:
- Comprehensive company evaluation (governance, workers, community, environment)
- B Corp certification requirement
- 200,000+ companies assessed
SDG Alignment Tools:
- Map investments to UN Sustainable Development Goals
- Portfolio reporting: % aligned to each SDG
- Impact themes: Climate (SDG 13), Clean energy (SDG 7), etc.
ACTIVITY 5: Sustainable Finance Commitment (10 min)
I, ________________, commit to sustainable finance principles.
My Current Portfolio:
- Total value: €_____
- Fossil fuel exposure: €_____ (___%)
- ESG allocation: €_____ (___%)
- Target sustainable: ___% (recommend 50-100%)
My Transition Plan:
Phase 1 (Month 1): ☐ Audit complete portfolio
☐ Calculate fossil exposure
☐ Open ESG investment accounts
☐ Invest €_____ in ESG funds
Phase 2 (Months 2-6): ☐ Transition % of portfolio to sustainable
☐ Amount: €__
☐ Reallocate to: ESG index (%), green bonds (%), impact (___%)
Phase 3 (Months 7-12): ☐ Achieve target allocation: ___% sustainable
☐ Zero fossil fuel exposure in new investments
☐ Annual ESG review calendar set
My Investment Strategy:
☐ Conservative (8-11% return, low risk)
☐ Moderate (11-16% return, moderate risk)
☐ Aggressive (14-21% return, high risk)
Expected 10-year value: €_____ → €_____
My Advocacy:
☐ Request ESG options in 401(k)
☐ Switch to sustainable bank
☐ Shareholder advocacy (proxy voting for climate)
☐ Educate _____ friends/family
My Impact Goal:
- Capital redirected to climate solutions: €_____
- Expected CO₂ avoided: _____ tons (via financed projects)
- Fossil fuel divestment: €_____
Signature: ________________
Date: _____
Review Date: _____ (quarterly)
The Bottom Line: Your Capital Shapes the Future
Sustainable finance redirects $35 trillion from problem to solution. ESG funds outperform traditional (11.8% vs 11.2%). Green bonds finance renewable energy at 3-5% yields. Impact investments deliver market returns (10-18%) plus measurable outcomes. The fossil fuel industry receives $500B/year—your capital may be funding it. Sustainable finance offers better returns (0.5-2% premium), lower risk (avoiding stranded assets), and climate alignment.
Your choices:
- Audit: Know your fossil fuel exposure (likely 10-20%)
- Transition: Reallocate 30-70% to sustainable (ESG, green bonds, impact)
- Returns: Expect 8-21% depending on strategy (matches or beats traditional)
- Impact: Every €10,000 redirected is €10,000 not funding fossil fuels
The market is moving: $35T sustainable, growing 15-25%/year. Early movers capture returns + build the clean economy. Late movers hold stranded assets.
Your €50,000 invested sustainably for 10 years:
- Expected value: €130,000-220,000
- Fossil fuel divested: €6,500 (13% traditional exposure)
- Clean energy financed: €50,000
- Returns: Match or beat traditional
- Legacy: Capital aligned with values
Sustainable finance isn’t sacrifice—it’s smart investing. Welcome to the future of capital.
💰🌍📈